
Wireless Firewall Router User's Guide

P-335 Series User’s Guide
Chapter 2 Introducing the Web Configurator 58
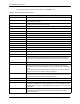
The following table describes the labels in this screen.
Table 9 Summary: Packet Statistics
LABEL DESCRIPTION
Port This is the WAN, LAN or WLAN port.
Status This displays the port speed and duplex setting if you're using Ethernet
encapsulation and down (line is down), idle (line (ppp) idle), dial (starting to
trigger a call) and drop (dropping a call) if you're using PPPoE encapsulation.
TxPkts This is the number of transmitted packets on this port.
RxPkts This is the number of received packets on this port.
Collisions This is the number of collisions on this port.
Tx B/s This displays the transmission speed in bytes per second on this port.
Rx B/s This displays the reception speed in bytes per second on this port.
Up Time This is the total amount of time the line has been up.
System Up Time This is the total time the Prestige has been on.
Poll Interval(s) Enter the time interval for refreshing statistics in this field.
Set Interval Click this button to apply the new poll interval you entered in the Poll Interval(s)
field.
Stop Click Stop to stop refreshing statistics, click Stop.
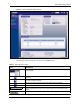
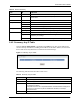
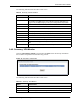
2.4.8 Summary: VPN Monitor
Click the VPN Monitor (Details...) hyperlink in the Status screen. Read-only information
here includes encapsulation mode and security protocol.
Figure 15 Summary: VPN Monitor
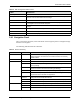
The following table describes the labels in this screen.
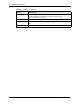
Table 10 Summary: VPN Monitor
TABLE DESCRIPTION
# This is the security index number.
Name This field displays the identification name for this VPN policy.
Encapsulation This field displays Tunnel or Transport mode.