
Getting Started Guide


106
CONTENTS
ABOUT THIS MANUAL
GETTING STARTED
SYSTEM OVERVIEW
SYSTEM SETUP
LIVE OPERATIONS
ANALYSIS OPERATIONS
> Overview
> Sessions
> Subsessions
> Graph Types
> Time Graphs
> Summary Graphs
> Graph Functions
> Print / Export
> Data Filters
> GPS Data
> Readiness
ANALYSIS IMPACT
PROCESSING
ANALYSIS REPORTS
LOG DATA
OMNISENSE
TM
WEB PORTAL
OMNISENSE
TM
MOBILE
OMNISENSE
TM
TOOLS
BASELINE FITNESS TESTING
FITNESS PARAMETERS
APPENDICES
EULA
SUPPORT
INDEX
OMNISENSE
TM
ANALYSIS OPERATIONS
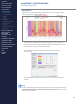
Overview (2/9)
Features
Time graphs Summary graphs Reports Impact Reports
Filter Sessions By
∙
Team, Subject
∙
Session Name
∙
Subsession Name
∙
Time/Date
Legend
∙
Compare up to 16 color-coded
sessions simultaneously
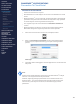
Manage Sessions
∙
Export, rename, move, delete &
archive
Export Graph Data
∙
Multiple le and image formats
Time Graphs
∙
Show 2 parameters of 46 available
∙
Automatic & Manual Fitness
Testing analysis
∙
Real or elapsed time
∙
ROG Status, training or speed
zone background colors
∙
Subsessions
Summary Graphs
∙
Show 2 parameters of 46 available
∙
Min/Max/Avg/Total displayed as
bar graphs
Fitness & Training Reports
∙
Compare individual against
normative or team data
∙
Mean & Std Dev
∙
Table & radar plot format
∙
Group Consolidated Summary
∙
Periodization Report
∙
Summary GPS
∙
Summary Physiological
∙
Workout Compliance
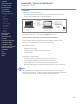
Impact Reports
∙
5 congurable impact zones by g
force
∙
Based on 100 Hz 3-axis data
∙
Summary impact counts per zone
∙
Magnitude, duration & direction of
impacts
∙
Automated grouping of impacts
by type
∙
Walk
∙
Run/intense run
∙
Bound/Jump
∙
Detailed analysis showing peak
g, rise time, duration, rate of
force development & decline
and total impulse load