
Getting Started Guide


148
OMNISENSE
TM
ANALYSIS OPERATIONS
GPS Data (2/2)
View Physiological Data from KML File
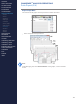
1. In Google Earth
TM
*
, right click on the imported .kml le, and select Show
Elevation Prole from the context menu.
2. A chart will be inserted under the main satellite display. Above the chart
are selectable elds of GPS and BioModule data; Heart Rate, Activity and
Peak Acceleration. Two of these may be selected for display on the chart.
3. As the mouse cursor is oated along the chart, a red arrow marker will
appear on the trace, with the selected parameters displaying beside it.
The same values will also display as call outs on the chart below.
CONTENTS
ABOUT THIS MANUAL
GETTING STARTED
SYSTEM OVERVIEW
SYSTEM SETUP
LIVE OPERATIONS
ANALYSIS OPERATIONS
> Overview
> Sessions
> Subsessions
> Graph Types
> Time Graphs
> Summary Graphs
> Graph Functions
> Print / Export
> Data Filters
> GPS Data
> Readiness
ANALYSIS IMPACT
PROCESSING
ANALYSIS REPORTS
LOG DATA
OMNISENSE
TM
WEB PORTAL
OMNISENSE
TM
MOBILE
OMNISENSE
TM
TOOLS
BASELINE FITNESS TESTING
FITNESS PARAMETERS
APPENDICES
EULA
SUPPORT
INDEX