
Getting Started Guide


133
OMNISENSE
TM
ANALYSIS OPERATIONS
Summary Graphs (8/8)
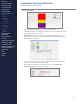
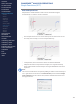
Summary Graph Preferences
The scaling of the vertical axis in some of the bar charts can be customized in
Preferences > Summary Graph.
∙
The default setting is Automatic. This scales the vertical axis to show the
maximum value of all sessions at the full height of the axis. If a large outlier
value in one session reduces the relative height of all other bars, then
Automatic can be set manually to a lower value.
CONTENTS
ABOUT THIS MANUAL
GETTING STARTED
SYSTEM OVERVIEW
SYSTEM SETUP
LIVE OPERATIONS
ANALYSIS OPERATIONS
> Overview
> Sessions
> Subsessions
> Graph Types
> Time Graphs
> Summary Graphs
> Graph Functions
> Print / Export
> Data Filters
> GPS Data
> Readiness
ANALYSIS IMPACT
PROCESSING
ANALYSIS REPORTS
LOG DATA
OMNISENSE
TM
WEB PORTAL
OMNISENSE
TM
MOBILE
OMNISENSE
TM
TOOLS
BASELINE FITNESS TESTING
FITNESS PARAMETERS
APPENDICES
EULA
SUPPORT
INDEX