
Getting Started Guide


132
OMNISENSE
TM
ANALYSIS OPERATIONS
Summary Graphs (7/8)
Summary
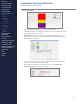
Summary charts are available for some impulse-related parameters, and speed
and elevation GPS data.
The format of the chart is a ‘box and whisker’ chart. This style of chart indicates
the range of values (minimum to maximum) and gives a graphic representation
of the distribution of values within that range.
Average Step Impulse Summary data
∙
Individual sessions in the graph legend can be checked or unchecked to
include or exclude them from the graph.
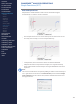
Box and Whisker Chart Format
This diagram shows how this chart type represents the distribution of data
within a data set.
∙
The lled ‘box’ represents the spread of the middle 50% of the data in
the set, centered on the median, the most common value. The taller
the box, the more broadly the data is distributed between the maximum
and minimum values. If the box is shorter (as above), then the data set is
relatively more concentrated around the median value.
∙
An explanation of box plots, including the unusual upper and lower
percentiles, can be found at http://en.wikipedia/wiki/BoxPlot
CONTENTS
ABOUT THIS MANUAL
GETTING STARTED
SYSTEM OVERVIEW
SYSTEM SETUP
LIVE OPERATIONS
ANALYSIS OPERATIONS
> Overview
> Sessions
> Subsessions
> Graph Types
> Time Graphs
> Summary Graphs
> Graph Functions
> Print / Export
> Data Filters
> GPS Data
> Readiness
ANALYSIS IMPACT
PROCESSING
ANALYSIS REPORTS
LOG DATA
OMNISENSE
TM
WEB PORTAL
OMNISENSE
TM
MOBILE
OMNISENSE
TM
TOOLS
BASELINE FITNESS TESTING
FITNESS PARAMETERS
APPENDICES
EULA
SUPPORT
INDEX