
Getting Started Guide


128
OMNISENSE
TM
ANALYSIS OPERATIONS
Summary Graphs (3/8)
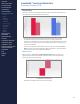
Total
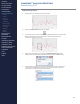
Total values display exactly as max/min/avg, but are only relevant for some
parameters; various impact counts, workout loads and distance travelled.
∙
Total values can be graphed simultaneously with max/min/avg values.
Average Heart Rate compared to Total Physiological Load.
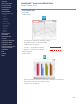
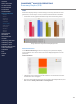
Stacked Total Charts
In the Workout Summary parameter category, four parameters display
as a stacked bar chart. These charts cannot be displayed against a second
parameter.
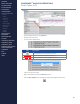
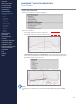
Time in HR Zones
∙
Individual zones in the legend can be checked or unchecked to include or
exclude them from the graph.
∙
The zone thresholds are xed at 0-64/65-84/85-100 Subject HR max, and
not related to Safety Thresholds or Training Zones
CONTENTS
ABOUT THIS MANUAL
GETTING STARTED
SYSTEM OVERVIEW
SYSTEM SETUP
LIVE OPERATIONS
ANALYSIS OPERATIONS
> Overview
> Sessions
> Subsessions
> Graph Types
> Time Graphs
> Summary Graphs
> Graph Functions
> Print / Export
> Data Filters
> GPS Data
> Readiness
ANALYSIS IMPACT
PROCESSING
ANALYSIS REPORTS
LOG DATA
OMNISENSE
TM
WEB PORTAL
OMNISENSE
TM
MOBILE
OMNISENSE
TM
TOOLS
BASELINE FITNESS TESTING
FITNESS PARAMETERS
APPENDICES
EULA
SUPPORT
INDEX