
Getting Started Guide


127
OMNISENSE
TM
ANALYSIS OPERATIONS
Summary Graphs (2/8)
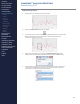
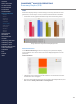
Max/Min/Avg
Maximum, minimum and average values for a given parameter and session are
calculated each time the parameter is selected.
∙
Max/Min/Avg values are available for parameters which are recorded
periodically during a session (such as heart rate, activity level). If the
parameter is cumulative, such as the number of calories burned, or the total
number of steps detected, then max/min/avg values have no meaning, and
they are not available.
∙
If the two parameters selected have the same units (e.g. Max & Avg Heart
Rate, as above, then they both display against the left axis. The axis title will
indicate which summary variables are displayed.
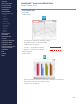
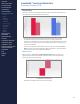
Negative Values
Two parameters - Posture and Peak Magnitude Theta impact angle, may
report negative values. If paired with a positive value on the chart, then the
results may look initially confusing.
Peak Magnitude Theta Min & Max.
∙
Minimum is a negative value, maximum is positive.
CONTENTS
ABOUT THIS MANUAL
GETTING STARTED
SYSTEM OVERVIEW
SYSTEM SETUP
LIVE OPERATIONS
ANALYSIS OPERATIONS
> Overview
> Sessions
> Subsessions
> Graph Types
> Time Graphs
> Summary Graphs
> Graph Functions
> Print / Export
> Data Filters
> GPS Data
> Readiness
ANALYSIS IMPACT
PROCESSING
ANALYSIS REPORTS
LOG DATA
OMNISENSE
TM
WEB PORTAL
OMNISENSE
TM
MOBILE
OMNISENSE
TM
TOOLS
BASELINE FITNESS TESTING
FITNESS PARAMETERS
APPENDICES
EULA
SUPPORT
INDEX