
Getting Started Guide


126
OMNISENSE
TM
ANALYSIS OPERATIONS
Summary Graphs (1/8)
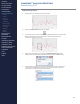
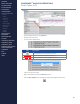
Select Summary Variables
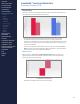
Select summary variables to populate the graph.
∙
Select two variables. Maximum, Minimum, Average, Total and Summary
are available according to context.
∙
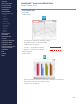
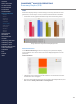
The columns are labelled A - P to correspond the Legend entries. As for line
graphs, separate subjects will be colored dierently.
∙
1st variable selected = left axis, solid ll
∙
2nd Variable selected = right axis, dashed ll
∙
As there is no vertical cursor, the value of each bar is shown as a call out
above the bar .
∙
If all sessions are from the same subject, then they will be colored
identically.
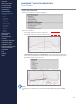
Note
If a variable is deselected, any remaining variables will display against the left
axis.
CONTENTS
ABOUT THIS MANUAL
GETTING STARTED
SYSTEM OVERVIEW
SYSTEM SETUP
LIVE OPERATIONS
ANALYSIS OPERATIONS
> Overview
> Sessions
> Subsessions
> Graph Types
> Time Graphs
> Summary Graphs
> Graph Functions
> Print / Export
> Data Filters
> GPS Data
> Readiness
ANALYSIS IMPACT
PROCESSING
ANALYSIS REPORTS
LOG DATA
OMNISENSE
TM
WEB PORTAL
OMNISENSE
TM
MOBILE
OMNISENSE
TM
TOOLS
BASELINE FITNESS TESTING
FITNESS PARAMETERS
APPENDICES
EULA
SUPPORT
INDEX