
Getting Started Guide


123
OMNISENSE
TM
ANALYSIS OPERATIONS
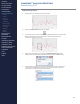
Graph Types (2/3)
Reports
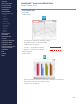
Training Reports
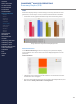
Training Reports display a selection of parameters in table format, color coded
to relate each individual’s statistics against the mean and standard deviation
for the group. The activity or training session for which the report covers is
decided by the user.
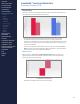
A radar plot compares individual subject statistics against the group’s.
There are ve Training report variations:
∙
Group Consolidated Summary (super-set of all parameters)
∙
Physiological Summary (heart rate related parameters)
∙
Periodization Report (Intensity & Load Parameters)
∙
Workout Compliance Report (Training Zone parameters)
∙
Summary GPS Report (GPS related parameters - Speed etc)
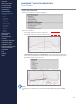
Fitness Reports
A tness report compares a subject or team’s tness parameters against a
selected normative (elite athletes or user-generated) in table, chart and radar
plot format.
The tness parameters used are:
∙
VO
2
max
∙
HR @ AT as % HR max
∙
HR min Resting
∙
%VO
2
max @ AT
∙
BR @ AT
∙
BR min Resting
∙
HR max
∙
HR Recovery 30 sec
∙
HRV @ Rest
∙
HR @ AT
∙
HR min Standing
∙
Fitness Level
The data used are the subject tness parameters which have been saved as a
result of tness test analyses.
Refer to the Analysis Reports section for details.
CONTENTS
ABOUT THIS MANUAL
GETTING STARTED
SYSTEM OVERVIEW
SYSTEM SETUP
LIVE OPERATIONS
ANALYSIS OPERATIONS
> Overview
> Sessions
> Subsessions
> Graph Types
> Time Graphs
> Summary Graphs
> Graph Functions
> Print / Export
> Data Filters
> GPS Data
> Readiness
ANALYSIS IMPACT
PROCESSING
ANALYSIS REPORTS
LOG DATA
OMNISENSE
TM
WEB PORTAL
OMNISENSE
TM
MOBILE
OMNISENSE
TM
TOOLS
BASELINE FITNESS TESTING
FITNESS PARAMETERS
APPENDICES
EULA
SUPPORT
INDEX