
Getting Started Guide


115
OMNISENSE
TM
ANALYSIS OPERATIONS
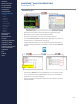
Sessions (2/5)
Workow
1. Select graph type using the appropriate toolbar button
Time (Line graph) Summary (Bar graph)
2. If a report is needed, rather than a graph, select the appropriate tab. Refer
to the Analysis Reports topic.
3. Use lter pull downs to populate the Select Session tree. The From date
defaults to 14 days before the current date. This is congurable in
Analysis Preferences.
4. Drag and drop, or double-click sessions to populate the Legend.
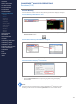
5. Select 2 parameters to display on a graph (3 parameters are automatically
displayed for Treadmill or Beep tests).
Note
When selecting parameters, the rst parameter selected units display on
the left-side vertical axis. If either parameter is de-selected, the remaining
parameter’s units will display on the left side vertical axis.
If a third parameter is selected, the second selected parameter displays on the
left side axis, and the third on the right side. The rst parameter selected is
automatically de-selected.
1
23
4
5
CONTENTS
ABOUT THIS MANUAL
GETTING STARTED
SYSTEM OVERVIEW
SYSTEM SETUP
LIVE OPERATIONS
ANALYSIS OPERATIONS
> Overview
> Sessions
> Subsessions
> Graph Types
> Time Graphs
> Summary Graphs
> Graph Functions
> Print / Export
> Data Filters
> GPS Data
> Readiness
ANALYSIS IMPACT
PROCESSING
ANALYSIS REPORTS
LOG DATA
OMNISENSE
TM
WEB PORTAL
OMNISENSE
TM
MOBILE
OMNISENSE
TM
TOOLS
BASELINE FITNESS TESTING
FITNESS PARAMETERS
APPENDICES
EULA
SUPPORT
INDEX