CONTENTS ABOUT THIS MANUAL GETTING STARTED ANALYSIS IMPACT PROCESSING Overview (1/7) SYSTEM OVERVIEW SYSTEM SETUP LIVE OPERATIONS ANALYSIS OPERATIONS ANALYSIS IMPACT PROCESSING > Overview > AccelPro Impact Report ANALYSIS REPORTS Accelerometry Overview The BioModule contains a 3-axis accelerometer which samples at 100Hz over the range ±16g.
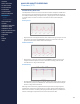
CONTENTS ABOUT THIS MANUAL GETTING STARTED ANALYSIS IMPACT PROCESSING Overview (2/7) SYSTEM OVERVIEW SYSTEM SETUP LIVE OPERATIONS ANALYSIS OPERATIONS ANALYSIS IMPACT PROCESSING Accelerometer Magnitude The same three impacts shown in the previous section are illustrated here using data from the external accelerometer magnitude (Accel) file generated by the ZephyrTM Downloader.
CONTENTS ABOUT THIS MANUAL GETTING STARTED ANALYSIS IMPACT PROCESSING Overview (3/7) SYSTEM OVERVIEW SYSTEM SETUP LIVE OPERATIONS ANALYSIS OPERATIONS ANALYSIS IMPACT PROCESSING > Overview > AccelPro Impact Report ANALYSIS REPORTS Enhanced Summary Data Impact processing is dependent on detailed analysis of accelerometer data. Detailed 3-axis accelerometer data cannot be transmitted to OmniSenseTM Live for more than one subject at a time, due to radio bandwidth limitations.
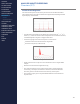
CONTENTS ABOUT THIS MANUAL GETTING STARTED ANALYSIS IMPACT PROCESSING Overview (4/7) SYSTEM OVERVIEW SYSTEM SETUP LIVE OPERATIONS ANALYSIS OPERATIONS ANALYSIS IMPACT PROCESSING > Overview > AccelPro Impact Report Accel Waveform Data Detailed impact analysis - potentially on multiple subjects - is dependent on external files of accelerometer waveform data. The BioModule must be configured to log in Summary and Waveform or Enhanced Summary and Waveform format.
CONTENTS ABOUT THIS MANUAL GETTING STARTED ANALYSIS IMPACT PROCESSING Overview (5/7) SYSTEM OVERVIEW SYSTEM SETUP LIVE OPERATIONS ANALYSIS OPERATIONS ANALYSIS IMPACT PROCESSING > Overview Types of Impulse An impulse is any force event which results in a signature in the accelerometer data. OmniSenseTM will analyze the accelerometer waveform data and classify impulse events into two types; impact events, and step events.
CONTENTS ABOUT THIS MANUAL GETTING STARTED ANALYSIS IMPACT PROCESSING Overview (6/7) SYSTEM OVERVIEW SYSTEM SETUP LIVE OPERATIONS ANALYSIS OPERATIONS ANALYSIS IMPACT PROCESSING > Overview Impact Zones of Severity Impacts are categorized into five Zones of Severity (Exposure Index) for ease of analysis. The zones are classified by Peak Accelerometer Magnitude and can be set in the Edit > Preferences menu option in the ZephyrTM Impact Processor Tool.
CONTENTS ABOUT THIS MANUAL GETTING STARTED ANALYSIS IMPACT PROCESSING Overview (7/7) SYSTEM OVERVIEW SYSTEM SETUP LIVE OPERATIONS ANALYSIS OPERATIONS ANALYSIS IMPACT PROCESSING > Overview > AccelPro Impact Report ANALYSIS REPORTS LOG DATA OMNISENSETM WEB PORTAL Impact Angle Analysis of the X, Y & Z accelerometer components can determine the direction from which the impact event has originated. This is indicated by two angles, measured in degrees: ∙ ∙ Theta - angle in the horizontal plane.
CONTENTS ABOUT THIS MANUAL GETTING STARTED ANALYSIS IMPACT PROCESSING AccelPro Impact Report (1/9) SYSTEM OVERVIEW SYSTEM SETUP LIVE OPERATIONS ANALYSIS OPERATIONS ANALYSIS IMPACT PROCESSING > Overview AccelPro Impact Report Prerequisites In order to be able to generate an AccelPro report: ∙ > AccelPro Impact Report ANALYSIS REPORTS Accelerometer waveform data must have been logged in the subject BioModule configured to log in Summary and Waveform or Enhanced Summary and Waveform format.
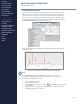
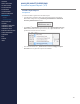
CONTENTS ABOUT THIS MANUAL GETTING STARTED ANALYSIS IMPACT PROCESSING AccelPro Impact Report (2/9) SYSTEM OVERVIEW SYSTEM SETUP LIVE OPERATIONS ANALYSIS OPERATIONS ANALYSIS IMPACT PROCESSING Impact Processor Tool 1. Start the Impact Processor Tool using the toolbar button in Analysis. 2. The ZephyrTM Impact Processor will display, showing all ‘..._Accel’ files in the default file location which have not yet been processed by the tool. The default location can be reset in the Preferences of the tool .
CONTENTS ABOUT THIS MANUAL GETTING STARTED ANALYSIS IMPACT PROCESSING AccelPro Impact Report (3/9) SYSTEM OVERVIEW SYSTEM SETUP LIVE OPERATIONS ANALYSIS OPERATIONS 5.
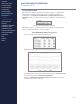
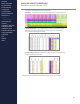
CONTENTS ABOUT THIS MANUAL GETTING STARTED ANALYSIS IMPACT PROCESSING AccelPro Impact Report (4/9) SYSTEM OVERVIEW SYSTEM SETUP LIVE OPERATIONS ANALYSIS OPERATIONS ANALYSIS IMPACT PROCESSING Report Summary Tab The Summary tab shows counts of the various impulse types and some summary values for the impact severity zones and step types.
CONTENTS ABOUT THIS MANUAL GETTING STARTED ANALYSIS IMPACT PROCESSING AccelPro Impact Report (5/9) SYSTEM OVERVIEW SYSTEM SETUP LIVE OPERATIONS Summary Parameters ANALYSIS OPERATIONS Parameter Description ANALYSIS IMPACT PROCESSING Average Force Development Rate Average of all events in each walking/running/ bounding/jumping type in Newtons per Second. This is a measure of how ‘sharp’ or ‘soft’ an impulse is. Average Peak g Average Peak g of all events categorized as above.
CONTENTS ABOUT THIS MANUAL GETTING STARTED ANALYSIS IMPACT PROCESSING AccelPro Impact Report (6/9) SYSTEM OVERVIEW SYSTEM SETUP LIVE OPERATIONS ANALYSIS OPERATIONS ANALYSIS IMPACT PROCESSING Impulse Data Lines Tab The summary tab itemizes each detected impulse (impact or step type) and provides more detailed analysis. The first column in each record is a hyperlink to the relevant lines in the Accelerometry Stream tab of the report.
CONTENTS ABOUT THIS MANUAL GETTING STARTED ANALYSIS IMPACT PROCESSING AccelPro Impact Report (7/9) SYSTEM OVERVIEW SYSTEM SETUP LIVE OPERATIONS ANALYSIS OPERATIONS ANALYSIS IMPACT PROCESSING Report Summary Tab Data Filters Each column heading in the Impulse Data Lines tab of the report has a data filtering pull down . Use this to select specific entries of interest. > Overview > AccelPro Impact Report 1.
CONTENTS ABOUT THIS MANUAL GETTING STARTED ANALYSIS IMPACT PROCESSING AccelPro Impact Report (8/9) SYSTEM OVERVIEW SYSTEM SETUP LIVE OPERATIONS ANALYSIS OPERATIONS ANALYSIS IMPACT PROCESSING > Overview > AccelPro Impact Report Accelerometry Stream Tab This tab contains a line for every individual accelerometer sample at 100 Hz, and as such may contain a very large number of lines of data. Browsing the tab itself will be time consuming.
CONTENTS ABOUT THIS MANUAL GETTING STARTED ANALYSIS IMPACT PROCESSING AccelPro Impact Report (9/9) SYSTEM OVERVIEW SYSTEM SETUP LIVE OPERATIONS Accelerometry Stream Parameters ANALYSIS OPERATIONS Parameter Description ANALYSIS IMPACT PROCESSING Time Timestamp of 100 Hz accelerometer data sample. Vertical g Vertical 3-axis g component. Lateral g Lateral (subject side to side) g component. Sagittal g Sagittal (subject front to rear) g component.
CONTENTS ABOUT THIS MANUAL GETTING STARTED ANALYSIS REPORTS Overview (1/3) SYSTEM OVERVIEW SYSTEM SETUP LIVE OPERATIONS ANALYSIS OPERATIONS ANALYSIS IMPACT PROCESSING ANALYSIS REPORTS > Overview > Parameters & Color Coding > Manage Reports > Report Categories LOG DATA OMNISENSE WEB PORTAL TM OMNISENSETM MOBILE OMNISENSETM TOOLS BASELINE FITNESS TESTING Fitness Reports Fitness Reports make comparisons for a selection of fitness parameters which are already held in the OmniSenseTM database.
CONTENTS ABOUT THIS MANUAL GETTING STARTED ANALYSIS REPORTS Overview (2/3) SYSTEM OVERVIEW SYSTEM SETUP LIVE OPERATIONS Table ANALYSIS OPERATIONS ANALYSIS IMPACT PROCESSING ANALYSIS REPORTS > Overview > Parameters & Color Coding > Manage Reports > Report Categories LOG DATA OMNISENSETM WEB PORTAL OMNISENSETM MOBILE OMNISENSETM TOOLS BASELINE FITNESS TESTING FITNESS PARAMETERS APPENDICES EULA ∙ The table gives the same information as in the radar plot.
CONTENTS ABOUT THIS MANUAL GETTING STARTED ANALYSIS REPORTS Overview (3/3) SYSTEM OVERVIEW SYSTEM SETUP LIVE OPERATIONS ANALYSIS OPERATIONS ANALYSIS IMPACT PROCESSING ANALYSIS REPORTS > Overview > Parameters & Color Coding Training Reports To create a Training Report, select specific sessions or subsessions from the Select Sessions pane and drag them to the Training Report pane. The Training Report will reflect a subject’s performance - compared to the mean for all the sessions in the report.
CONTENTS ABOUT THIS MANUAL GETTING STARTED ANALYSIS REPORTS Parameters & Color Coding (1/2) SYSTEM OVERVIEW SYSTEM SETUP LIVE OPERATIONS ANALYSIS OPERATIONS ANALYSIS IMPACT PROCESSING ANALYSIS REPORTS > Overview Report Parameters This table shows the parameters available in each report type. Parameter Start Time All Start time of session. Duration All Duration of session.
CONTENTS ABOUT THIS MANUAL GETTING STARTED ANALYSIS REPORTS Parameters & Color Coding (2/2) SYSTEM OVERVIEW SYSTEM SETUP LIVE OPERATIONS ANALYSIS OPERATIONS ANALYSIS IMPACT PROCESSING Report Table Coloring All training report SessionSummary tables use cell coloring to give an immediate representation of how one subject is performing relative to the team.
CONTENTS ABOUT THIS MANUAL GETTING STARTED ANALYSIS REPORTS Manage Reports (1/3) SYSTEM OVERVIEW SYSTEM SETUP LIVE OPERATIONS ANALYSIS OPERATIONS ANALYSIS IMPACT PROCESSING Create Report 1. Select Training Reports tab. 2. Use the Filter Session List to populate the Select Session pane with desired subjects and sessions. 3. Right-click a session and select Copy Sessions To > Training Reports to populate the report pane, or click-and-drag individual sessions. 4.
CONTENTS ABOUT THIS MANUAL GETTING STARTED ANALYSIS REPORTS Manage Reports (2/3) SYSTEM OVERVIEW SYSTEM SETUP LIVE OPERATIONS ANALYSIS OPERATIONS ANALYSIS IMPACT PROCESSING ANALYSIS REPORTS > Overview > Parameters & Color Coding Export Report Once a report has been generated, viewing within the Analysis window is restricted by screen size. The best option is to export the report. There are two options. Print Report 1. Print the report using the Print button on the top right side of the report pane.
CONTENTS ABOUT THIS MANUAL GETTING STARTED ANALYSIS REPORTS Manage Reports (3/3) SYSTEM OVERVIEW SYSTEM SETUP LIVE OPERATIONS ANALYSIS OPERATIONS ANALYSIS IMPACT PROCESSING ANALYSIS REPORTS > Overview Edit Report Some reports, particularly the Group Consolidated Summary, may contain columns with no data (usually GPS data), or columns of data supported by the Enhanced Summary data packet/log format, which are not used by other data packets or log formats.
CONTENTS ABOUT THIS MANUAL GETTING STARTED ANALYSIS REPORTS Report Categories (1/5) SYSTEM OVERVIEW SYSTEM SETUP LIVE OPERATIONS ANALYSIS OPERATIONS ANALYSIS IMPACT PROCESSING Group Consolidated Summary The Consolidated Summary is the super-set of all other reports, and contains all available data parameters.
CONTENTS ABOUT THIS MANUAL GETTING STARTED ANALYSIS REPORTS Report Categories (2/5) SYSTEM OVERVIEW SYSTEM SETUP LIVE OPERATIONS ANALYSIS OPERATIONS ANALYSIS IMPACT PROCESSING ANALYSIS REPORTS Periodization Report This report shows Mechanical, Physiological and Training (average of Mechanical & Physical) loads and intensities. See the Fitness Parameters section for more detail. Its intended use is for a team training over a variety of different workouts for an extended period of time.
CONTENTS ABOUT THIS MANUAL GETTING STARTED ANALYSIS REPORTS Report Categories (3/5) SYSTEM OVERVIEW SYSTEM SETUP LIVE OPERATIONS Summary GPS ANALYSIS IMPACT PROCESSING This report contains distance, speed and elevation values derived from GPS data. The Speed Zones referred to are configurable in Preferences in both Live and Analysis.
CONTENTS ABOUT THIS MANUAL GETTING STARTED ANALYSIS REPORTS Report Categories (4/5) SYSTEM OVERVIEW SYSTEM SETUP LIVE OPERATIONS ANALYSIS OPERATIONS ANALYSIS IMPACT PROCESSING Summary Physiological This report contains a number of parameters, all of which are heart ratederived.
CONTENTS ABOUT THIS MANUAL GETTING STARTED ANALYSIS REPORTS Report Categories (5/5) SYSTEM OVERVIEW SYSTEM SETUP LIVE OPERATIONS Workout Compliance ANALYSIS IMPACT PROCESSING This report shares some parameters with the Periodization report, but also contains Training Zone data. Training Zone thresholds are configurable in Live & Analysis Preferences.
CONTENTS ABOUT THIS MANUAL GETTING STARTED LOG DATA Overview (1/5) SYSTEM OVERVIEW SYSTEM SETUP LIVE OPERATIONS ANALYSIS OPERATIONS ANALYSIS IMPACT PROCESSING ANALYSIS REPORTS LOG DATA > Overview > ZephyrTM Downloader Overview When new BioModules are shipped: ∙ ∙ ∙ Logging is enabled. The default logging format is Enhanced Summary (see Appendices 3 & 4 for complete descriptions of all the log formats). Log format is configured using the ZephyrTM Config Tool. Refer to the OmniSenseTM Tools topic.
CONTENTS ABOUT THIS MANUAL GETTING STARTED LOG DATA Overview (2/5) SYSTEM OVERVIEW SYSTEM SETUP LIVE OPERATIONS ANALYSIS OPERATIONS ANALYSIS IMPACT PROCESSING ANALYSIS REPORTS LOG DATA > Overview > ZephyrTM Downloader OMNISENSETM WEB PORTAL OMNISENSETM MOBILE OMNISENSETM TOOLS BASELINE FITNESS TESTING FITNESS PARAMETERS APPENDICES EULA SUPPORT INDEX ∙ ∙ ∙ A menu option in the ZephyrTM Downloader will cause external files to be generated when data is imported from the BioModule into OmniSenseTM Analysi
CONTENTS ABOUT THIS MANUAL GETTING STARTED LOG DATA Overview (3/5) SYSTEM OVERVIEW SYSTEM SETUP LIVE OPERATIONS Log Download Times ANALYSIS OPERATIONS ANALYSIS IMPACT PROCESSING ANALYSIS REPORTS LOG DATA > Overview > ZephyrTM Downloader OMNISENSETM WEB PORTAL OMNISENSETM MOBILE OMNISENSETM TOOLS BASELINE FITNESS TESTING FITNESS PARAMETERS APPENDICES ∙ ∙ EULA SUPPORT INDEX ∙ Download data via a 50 BioModule Charge Case (shown above), single- or 5-device cradles.
CONTENTS ABOUT THIS MANUAL GETTING STARTED LOG DATA Overview (4/5) SYSTEM OVERVIEW SYSTEM SETUP LIVE OPERATIONS ANALYSIS OPERATIONS ANALYSIS IMPACT PROCESSING ANALYSIS REPORTS BioModule Logging Capacity ∙ ∙ The Summary format is an extended format compared to General. Enhanced Summary contains extended accelerometer data.
CONTENTS ABOUT THIS MANUAL GETTING STARTED LOG DATA Overview (5/5) SYSTEM OVERVIEW SYSTEM SETUP LIVE OPERATIONS ANALYSIS OPERATIONS ANALYSIS IMPACT PROCESSING Logging Configuration Checklist 1. The BioModule must be configured to log (Log Enable is the default configuration for shipped BioModules). 2. Log Format: Enhanced Summary for general use, Enhanced Summary + Wave for use with a GPS. 3. GPS should be assigned to the subject in OmniSenseTM.
CONTENTS ABOUT THIS MANUAL GETTING STARTED LOG DATA ZephyrTM Downloader (1/5) SYSTEM OVERVIEW SYSTEM SETUP LIVE OPERATIONS ANALYSIS OPERATIONS Overview ∙ ANALYSIS IMPACT PROCESSING Connect BioModules to the host PC in charge cradles or a 50 BioModule Charge Case: ANALYSIS REPORTS LOG DATA > Overview > ZephyrTM Downloader OMNISENSETM WEB PORTAL OMNISENSETM MOBILE OMNISENSETM TOOLS BASELINE FITNESS TESTING ∙ Start the Downloader using the Launch Log Downloader button, selecting the From BH option.
CONTENTS ABOUT THIS MANUAL GETTING STARTED LOG DATA ZephyrTM Downloader (2/5) SYSTEM OVERVIEW SYSTEM SETUP LIVE OPERATIONS Downloader Menu Options ANALYSIS OPERATIONS Menu Item Description ANALYSIS IMPACT PROCESSING File/Exit Exit downloader View/Show Wizard Hide Show top panel with 1-5 step ‘Wizard’. ANALYSIS REPORTS LOG DATA > Overview > Zephyr Downloader TM OMNISENSETM WEB PORTAL OMNISENSETM MOBILE OMNISENSE TOOLS TM Options Retry on Error Automatically retry download if interrupted.
CONTENTS ABOUT THIS MANUAL GETTING STARTED LOG DATA ZephyrTM Downloader (3/5) SYSTEM OVERVIEW SYSTEM SETUP LIVE OPERATIONS ZephyrTM Downloader Operation ANALYSIS OPERATIONS ∙ ANALYSIS IMPACT PROCESSING Team Data Download Wizard Connect BioModules to PC using 50 BioModule Charge Case. Any other BioModule powered on will be detected over BluetoothTM* if the option is selected. ANALYSIS REPORTS LOG DATA 1.
CONTENTS ABOUT THIS MANUAL GETTING STARTED LOG DATA ZephyrTM Downloader (4/5) SYSTEM OVERVIEW SYSTEM SETUP LIVE OPERATIONS ANALYSIS OPERATIONS ANALYSIS IMPACT PROCESSING Expand Log View When a known device is detected by the Downloader, a button will appear in the first column of each entry. This button will display all the logs in the device.
CONTENTS ABOUT THIS MANUAL GETTING STARTED LOG DATA ZephyrTM Downloader (5/5) SYSTEM OVERVIEW SYSTEM SETUP LIVE OPERATIONS ANALYSIS OPERATIONS ANALYSIS IMPACT PROCESSING ANALYSIS REPORTS LOG DATA > Overview > ZephyrTM Downloader OMNISENSETM WEB PORTAL OMNISENSETM MOBILE OMNISENSETM TOOLS BASELINE FITNESS TESTING FITNESS PARAMETERS Auto Download The ZephyrTM Downloader has been designed to streamline log download from multiple devices, but there are some pre-requisites: ∙ ∙ ∙ ∙ APPENDICES EULA SUPPORT
CONTENTS ABOUT THIS MANUAL GETTING STARTED OMNISENSETM WEB PORTAL Overview (1/8) SYSTEM OVERVIEW SYSTEM SETUP LIVE OPERATIONS ANALYSIS OPERATIONS ANALYSIS IMPACT PROCESSING OmniSenseTM Local & OmniSenseTM Cloud OmniSenseTM Local OmniSenseTM Local exists solely on the PC on which it is installed.
CONTENTS ABOUT THIS MANUAL GETTING STARTED OMNISENSETM WEB PORTAL Overview (2/8) SYSTEM OVERVIEW SYSTEM SETUP LIVE OPERATIONS ANALYSIS OPERATIONS ANALYSIS IMPACT PROCESSING ANALYSIS REPORTS LOG DATA Portal Access Prior to access, users must supply an email to their Account Administrator. They will receive an email supplying a Username, Password and Customer Number. ∙ To access the web portal, go to https://os.zephyranywhere.com/om/ login.
CONTENTS ABOUT THIS MANUAL GETTING STARTED OMNISENSETM WEB PORTAL Overview (3/8) SYSTEM OVERVIEW SYSTEM SETUP LIVE OPERATIONS ANALYSIS OPERATIONS ANALYSIS IMPACT PROCESSING Connecting OmniSenseTM Local to the Cloud Both Live and Analysis local instances may be connected to the cloud database if a customer account exists. In both cases, there is an online/offline button in the application toolbar.
CONTENTS ABOUT THIS MANUAL GETTING STARTED OMNISENSE WEB PORTAL Overview (4/8) SYSTEM OVERVIEW SYSTEM SETUP LIVE OPERATIONS ANALYSIS OPERATIONS Lost Password If a password is forgotten, you will need to return to the web portal itself. https://os.zephyranywhere.com/om/login ANALYSIS IMPACT PROCESSING ANALYSIS REPORTS LOG DATA OMNISENSETM WEB PORTAL > Overview ∙ ∙ > Home Screen Enter your username into the login, and click on the FORGOT PASSWORD link below the Sign In button.
CONTENTS ABOUT THIS MANUAL GETTING STARTED OMNISENSETM WEB PORTAL Overview (5/8) SYSTEM OVERVIEW SYSTEM SETUP LIVE OPERATIONS ANALYSIS OPERATIONS How Accounts Work Definitions ANALYSIS IMPACT PROCESSING Term Description ANALYSIS REPORTS Account Client name for each customer. LOG DATA Subscription Fee Each account will have an affiliated monthly fee for each System, Administrator and Subject. Subjects Number of users in the system that are being monitored.
CONTENTS ABOUT THIS MANUAL GETTING STARTED OMNISENSETM WEB PORTAL Overview (6/8) SYSTEM OVERVIEW SYSTEM SETUP LIVE OPERATIONS ∙ Each account can have multiple users & multiple roles. ANALYSIS OPERATIONS ANALYSIS IMPACT PROCESSING ANALYSIS REPORTS LOG DATA OMNISENSETM WEB PORTAL > Overview > Home Screen > Default Widgets > Custom Widgets > My Profile > Live Screen > Analysis > Reports > Calendar > Devices ∙ ∙ > Teams A user can be a member of multiple accounts (team, personal trainer etc.).
CONTENTS ABOUT THIS MANUAL GETTING STARTED OMNISENSETM WEB PORTAL Overview (7/8) SYSTEM OVERVIEW SYSTEM SETUP LIVE OPERATIONS ANALYSIS OPERATIONS ANALYSIS IMPACT PROCESSING ANALYSIS REPORTS LOG DATA OMNISENSETM WEB PORTAL > Overview > Home Screen > Default Widgets User Roles and Permissions ∙ ∙ ∙ ∙ Different roles of user have different sets of permissions within an account, from Administrator to Athlete. The roles below are optional - they need not all be used.
CONTENTS ABOUT THIS MANUAL GETTING STARTED OMNISENSETM WEB PORTAL Overview (8/8) SYSTEM OVERVIEW OMNISENSETM WEB PORTAL > Overview Manage Account Settings & Defaults > Default Widgets Manage Roles > Custom Widgets Manage Teams > My Profile Manager Users > Live Screen View Team Data View Own Data > Calendar View Training Plans > Devices View Workouts > Teams Manage Workouts Manage
CONTENTS ABOUT THIS MANUAL GETTING STARTED OMNISENSETM WEB PORTAL Home Screen (1/4) SYSTEM OVERVIEW SYSTEM SETUP LIVE OPERATIONS ANALYSIS OPERATIONS ANALYSIS IMPACT PROCESSING ANALYSIS REPORTS LOG DATA OMNISENSETM WEB PORTAL > Overview > Home Screen > Default Widgets Dashboard On initial login, a user will be presented with their Home screen. The main panel within this is a Dashboard. ∙ ∙ ∙ The dashboard consists of an array of Widgets which can dynamically update their data at each login.
CONTENTS ABOUT THIS MANUAL GETTING STARTED OMNISENSETM WEB PORTAL Home Screen (2/4) SYSTEM OVERVIEW SYSTEM SETUP LIVE OPERATIONS ANALYSIS OPERATIONS ANALYSIS IMPACT PROCESSING ANALYSIS REPORTS Dashboard Header & Navigation Header There are three active components in the header: Item LOG DATA Description Maximize or minimize (icons only) the navigation pane. OMNISENSETM WEB PORTAL > Overview Click to return to dashboard from other screens.
CONTENTS ABOUT THIS MANUAL GETTING STARTED OMNISENSETM WEB PORTAL Home Screen (3/4) SYSTEM OVERVIEW SYSTEM SETUP LIVE OPERATIONS ANALYSIS OPERATIONS ANALYSIS IMPACT PROCESSING Configure Dashboard The dashboard consists or an array of rows of widgets. Each row can be configured to show 1,2 or 3 widgets. Some widgets require full row width for display.