
Getting Started Guide


208
OMNISENSE
TM
WEB PORTAL
Custom Widgets (3/6)
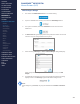
Summary Graph Widget Example
TinTZ-SUM
∙
This example shows a single parameter, Time in Training Zone, with a
legend.
∙
Sessions and athlete/team lters are xed, editable in Edit Widget.
∙
Will automatically populate with data for a xed period prior to the current
date. Default is previous 24 hours.
∙
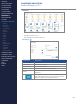
Training Zone Thresholds - and all other thresholds, can be congured in
the Threshold Settings screen of the portal, accessed from the navigation
panel. It is only visible to those with appropriate permissions. If the
same thresholds are updated from a PC, then the new thresholds will be
synchronized in the portal when the PC session is connected online (and
vice versa).
Note
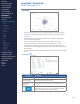
Summary graphs are more suitable as dashboard widgets, as the columns
do not obscure each other, and are designed for at-a-glance comparisons
between athletes or sessions.
Edit Widget
∙
All editing functionality and elds are as described in the previous example.
CONTENTS
ABOUT THIS MANUAL
GETTING STARTED
SYSTEM OVERVIEW
SYSTEM SETUP
LIVE OPERATIONS
ANALYSIS OPERATIONS
ANALYSIS IMPACT
PROCESSING
ANALYSIS REPORTS
LOG DATA
OMNISENSE
TM
WEB PORTAL
> Overview
> Home Screen
> Default Widgets
> Custom Widgets
> My Prole
> Live Screen
> Analysis
> Reports
> Calendar
> Devices
> Teams
> Athletes
> Manage User Roles
> Manage Users
> Training Plans
> Preferences
> Threshold Settings
OMNISENSE
TM
MOBILE
OMNISENSE
TM
TOOLS
BASELINE FITNESS TESTING
FITNESS PARAMETERS
APPENDICES
EULA
SUPPORT
INDEX