
Getting Started Guide


239
OMNISENSE
TM
WEB PORTAL
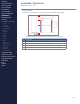
Athletes (1/2)
Athlete Status
The Athletes screen in the portal gives an overview of an athlete’s status, using
all physiological metrics established during Readiness and Fitness tests. These
are presented in table and radar plot format, allowing comparison with the
athlete’s team average values.
∙
You must have permission to view an athlete’s data.
# Description
1 Select Team from pull down list.
2 Select the Athlete from the list.
3 Summary of tness metrics for selected athlete.
4 Select the team average to compare the selected athlete’s statistics.
5 Athlete’s metric compared to selection in 4, in table format.
6 Radar plot - see below.
Radar Plot
∙
Axes on radar plot are all scaled to give regular blue & gray polygons.
∙
Blue inner and gray outer polygons - the 50% and 100% levels for the team
selected in Compared With.
∙
Axes are oriented so that outside the blue polygon indicates better
than team average performance - for some values this is higher, such as
VO
2
max, and for others lower, such as resting HR.
∙
If the red value is inside the blue inner polygon, then the athlete’s level is
below average compared to the selected team.
∙
Float cursor over plot to get exact percentile values.
3
1
2
5
4
6
CONTENTS
ABOUT THIS MANUAL
GETTING STARTED
SYSTEM OVERVIEW
SYSTEM SETUP
LIVE OPERATIONS
ANALYSIS OPERATIONS
ANALYSIS IMPACT
PROCESSING
ANALYSIS REPORTS
LOG DATA
OMNISENSE
TM
WEB PORTAL
> Overview
> Home Screen
> Default Widgets
> Custom Widgets
> My Prole
> Live Screen
> Analysis
> Reports
> Calendar
> Devices
> Teams
> Athletes
> Manage User Roles
> Manage Users
> Training Plans
> Preferences
> Threshold Settings
OMNISENSE
TM
MOBILE
OMNISENSE
TM
TOOLS
BASELINE FITNESS TESTING
FITNESS PARAMETERS
APPENDICES
EULA
SUPPORT
INDEX