
Getting Started Guide


234
OMNISENSE
TM
WEB PORTAL
Reports (17/17)
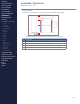
6. Below the table entries, the values which delineate the color boundaries
are listed.
Item Description
Signicantly High
One standard deviation above the mean value.
Values greater than this will be colored red.
Signicantly Low
One standard deviation below the mean value.
Values less than this will be colored yellow.
CONTENTS
ABOUT THIS MANUAL
GETTING STARTED
SYSTEM OVERVIEW
SYSTEM SETUP
LIVE OPERATIONS
ANALYSIS OPERATIONS
ANALYSIS IMPACT
PROCESSING
ANALYSIS REPORTS
LOG DATA
OMNISENSE
TM
WEB PORTAL
> Overview
> Home Screen
> Default Widgets
> Custom Widgets
> My Prole
> Live Screen
> Analysis
> Reports
> Calendar
> Devices
> Teams
> Athletes
> Manage User Roles
> Manage Users
> Training Plans
> Preferences
> Threshold Settings
OMNISENSE
TM
MOBILE
OMNISENSE
TM
TOOLS
BASELINE FITNESS TESTING
FITNESS PARAMETERS
APPENDICES
EULA
SUPPORT
INDEX