
Getting Started Guide


231
CONTENTS
ABOUT THIS MANUAL
GETTING STARTED
SYSTEM OVERVIEW
SYSTEM SETUP
LIVE OPERATIONS
ANALYSIS OPERATIONS
ANALYSIS IMPACT
PROCESSING
ANALYSIS REPORTS
LOG DATA
OMNISENSE
TM
WEB PORTAL
> Overview
> Home Screen
> Default Widgets
> Custom Widgets
> My Prole
> Live Screen
> Analysis
> Reports
> Calendar
> Devices
> Teams
> Athletes
> Manage User Roles
> Manage Users
> Training Plans
> Preferences
> Threshold Settings
OMNISENSE
TM
MOBILE
OMNISENSE
TM
TOOLS
BASELINE FITNESS TESTING
FITNESS PARAMETERS
APPENDICES
EULA
SUPPORT
INDEX
OMNISENSE
TM
WEB PORTAL
Reports (14/17)
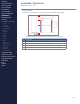
Summary Graph
The Summary graph indicates relative progress towards daily average goals.
Periodization graph with legend minimized and single load parameter displayed
# Description
1 Legend minimized - all parameters except calories de-selected.
2 Daily % Average parameter Load Goal - top of bar
3 Daily % Average parameter load Achieved - horizontal rectangle
4 Float mouse cursor over the graph to display the values as call-outs.
1
2
3
4