
Getting Started Guide


202
OMNISENSE
TM
WEB PORTAL
Default Widgets (2/5)
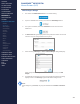
My Status
∙
A radar chart showing your own (or selected athlete, if coach) choice of 6
performance parameters (red line) versus a selected team (dark & light
polygons).
∙
Team data polygons - the boundary between inner dark and outer light
polygons is the team average.
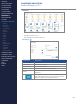
∙
Axes are scaled per parameter, with the outer edge of the polygon
representing the ‘best’ value captured for that parameter, e.g. a low
Standing HR is deemed better than high. Thus a red line which is always
outside the inner dark polygon reects performance above team average in
all parameters.
∙
Four selectable parameters display performance measures below the radar
chart.
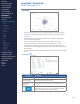
Edit Widget
Component Description
My Status Settings Select up to 4. They will display below the radar chart
Compare With
Select a Team from those available for comparison (the
solid polygons in the radar chart)
Radar Chart
Settings
Select the parameters to display on the radar chart
When saved, the lter settings will be retained, and the
data updated each time you log in again. Re-edit the
widget to update the settings at any time.
CONTENTS
ABOUT THIS MANUAL
GETTING STARTED
SYSTEM OVERVIEW
SYSTEM SETUP
LIVE OPERATIONS
ANALYSIS OPERATIONS
ANALYSIS IMPACT
PROCESSING
ANALYSIS REPORTS
LOG DATA
OMNISENSE
TM
WEB PORTAL
> Overview
> Home Screen
> Default Widgets
> Custom Widgets
> My Prole
> Live Screen
> Analysis
> Reports
> Calendar
> Devices
> Teams
> Athletes
> Manage User Roles
> Manage Users
> Training Plans
> Preferences
> Threshold Settings
OMNISENSE
TM
MOBILE
OMNISENSE
TM
TOOLS
BASELINE FITNESS TESTING
FITNESS PARAMETERS
APPENDICES
EULA
SUPPORT
INDEX