
Getting Started Guide


226
OMNISENSE
TM
WEB PORTAL
Reports (9/17)
Summary Graph
1. Select Report Type as Summary Graph.
∙
No background color or elapsed/real time selection is available for a
summary graph.
2. Select parameters
∙
Parameter type Max/Min/Avg/Total/Summary availability depends on
the parameter e.g. Max Calories does not make sense; there is a single
Calories Burned value per session.
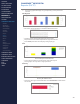
∙
A Summary parameter and some Total parameters cannot display
alongside any other selection. If selected it will deselect any other
active parameters. See the graph examples below.
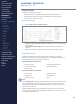
3. Filter sessions and select sessions exactly as for Over Time graphs in the
previous section.
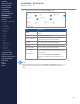
4. Group the summary graph bars using the Analyze Sessions By pane.
Item Description
Data Group
Select from None, Team, Athlete, Session
Name, Subsession Name.
Time Group Select from None/Days.
Time Frequency Select number of days.
∙
Data will be organized according to the settings.
CONTENTS
ABOUT THIS MANUAL
GETTING STARTED
SYSTEM OVERVIEW
SYSTEM SETUP
LIVE OPERATIONS
ANALYSIS OPERATIONS
ANALYSIS IMPACT
PROCESSING
ANALYSIS REPORTS
LOG DATA
OMNISENSE
TM
WEB PORTAL
> Overview
> Home Screen
> Default Widgets
> Custom Widgets
> My Prole
> Live Screen
> Analysis
> Reports
> Calendar
> Devices
> Teams
> Athletes
> Manage User Roles
> Manage Users
> Training Plans
> Preferences
> Threshold Settings
OMNISENSE
TM
MOBILE
OMNISENSE
TM
TOOLS
BASELINE FITNESS TESTING
FITNESS PARAMETERS
APPENDICES
EULA
SUPPORT
INDEX