
Getting Started Guide


223
OMNISENSE
TM
WEB PORTAL
Reports (6/17)
5. The Available Sessions pane will populated as selections are made in
Select Sessions By.
Double-click any session in Available Sessions to move it to Selected
Sessions, or use the button to move all.
∙
The button can be used to de-select all sessions, or the individual ‘X’
button for each.
∙
The color bar preceding each selected session corresponds to the color of
its graph trace.
∙
The graph or table will populate automatically as soon as graph parameters
and selected sessions are available.
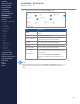
Over Time graph showing two parameters and Training Zone background coloring.
# Description
1 First selected parameter - solid trace, left vertical axis.
2 Float cursor over graph for call out of exact data values.
3 Second selected parameter, dotted trace, right vertical axis
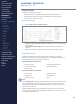
6. Use the 4 grab handles on the scaling bar below the graph to zoom in
vertically or horizontally.
7. Any of the above settings can be changed at any time to rene or adjust
the graph display.
8. Save the report as an Analysis Template or Widget Template if re-use is
anticipated.
1
3
2
CONTENTS
ABOUT THIS MANUAL
GETTING STARTED
SYSTEM OVERVIEW
SYSTEM SETUP
LIVE OPERATIONS
ANALYSIS OPERATIONS
ANALYSIS IMPACT
PROCESSING
ANALYSIS REPORTS
LOG DATA
OMNISENSE
TM
WEB PORTAL
> Overview
> Home Screen
> Default Widgets
> Custom Widgets
> My Prole
> Live Screen
> Analysis
> Reports
> Calendar
> Devices
> Teams
> Athletes
> Manage User Roles
> Manage Users
> Training Plans
> Preferences
> Threshold Settings
OMNISENSE
TM
MOBILE
OMNISENSE
TM
TOOLS
BASELINE FITNESS TESTING
FITNESS PARAMETERS
APPENDICES
EULA
SUPPORT
INDEX