
Getting Started Guide


219
OMNISENSE
TM
WEB PORTAL
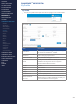
Reports (2/17)
Workow
1. Enter a Report Title - this will be used if the report is saved as an Analysis
Template or Dashboard Widget.
2. Select Report Type from the pull down list:
∙
Over Time Graph
∙
Summary Graph
∙
Readiness Graph
∙
Periodization
∙
Table Style Report
3. The Background Shading and Graph Axis items shown refer to Over
Time graphs. These items will vary according to the Report Type
selected. See the following sections.
4. Select the parameters to be displayed. As a rule the rst parameter
selected will refer to the left vertical axis, and the second to the right.
Available parameters will depend on Report Type.
5. Use the Select Sessions By pane to populate the Available Sessions
pane. The details of this pane will vary according to Report Type. See the
following sections.
CONTENTS
ABOUT THIS MANUAL
GETTING STARTED
SYSTEM OVERVIEW
SYSTEM SETUP
LIVE OPERATIONS
ANALYSIS OPERATIONS
ANALYSIS IMPACT
PROCESSING
ANALYSIS REPORTS
LOG DATA
OMNISENSE
TM
WEB PORTAL
> Overview
> Home Screen
> Default Widgets
> Custom Widgets
> My Prole
> Live Screen
> Analysis
> Reports
> Calendar
> Devices
> Teams
> Athletes
> Manage User Roles
> Manage Users
> Training Plans
> Preferences
> Threshold Settings
OMNISENSE
TM
MOBILE
OMNISENSE
TM
TOOLS
BASELINE FITNESS TESTING
FITNESS PARAMETERS
APPENDICES
EULA
SUPPORT
INDEX