
Getting Started Guide


216
OMNISENSE
TM
WEB PORTAL
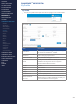
Analysis (1/2)
Overview
The Analysis landing screen in the portal shows sets of pre-congured
Reports:
∙
Analysis Templates to create reports to review directly in Analysis.
∙
Widget Templates for components of the Home screen dashboard.
This is to streamline use; if the parameters are being viewed regularly, then
select graph type, parameters, background color, real/elapsed time etc. and
save the desired Report,
∙
Portal accounts may contain a set of pre-existing templates.
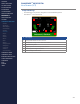
Using a pre-existing template
1. The only task is to select the sessions from which to populate the report.
The template icon will show whether the graph is Over Time, Summary
(bar or stacked bar chart), a Table or a Periodization report.
2. Select the template.
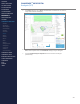
3. The Filter Sessions By panel will be congured to the Start Date and End
Date values at last update. Set these and use the Apply Filters button to
populate the Available Sessions panel.
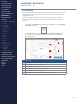
4. Click on sessions in the Available Sessions panel to add to the Selected
Sessions panel. The graph will then show the selected data.
CONTENTS
ABOUT THIS MANUAL
GETTING STARTED
SYSTEM OVERVIEW
SYSTEM SETUP
LIVE OPERATIONS
ANALYSIS OPERATIONS
ANALYSIS IMPACT
PROCESSING
ANALYSIS REPORTS
LOG DATA
OMNISENSE
TM
WEB PORTAL
> Overview
> Home Screen
> Default Widgets
> Custom Widgets
> My Prole
> Live Screen
> Analysis
> Reports
> Calendar
> Devices
> Teams
> Athletes
> Manage User Roles
> Manage Users
> Training Plans
> Preferences
> Threshold Settings
OMNISENSE
TM
MOBILE
OMNISENSE
TM
TOOLS
BASELINE FITNESS TESTING
FITNESS PARAMETERS
APPENDICES
EULA
SUPPORT
INDEX