
Getting Started Guide


210
OMNISENSE
TM
WEB PORTAL
Custom Widgets (5/6)
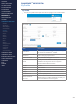
4. Enter the Report Title as preferred. The format Parameter1:Parameter2
- RT/ET/SUM is recommended.
5. Select Report Type as OverTime Graph, Summary Graph or Readiness
Graph. The list of parameters displayed below will adjust to match.
6. Select Background Shading from None/ROG/Training Zone/Speed Zone
and Graph Axis as Elapsed Time (ET) or Real Time (RT). These options
are available for Over Time Graphs only.
7. Selected the desired parameters from the list displayed below.
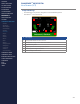
Over Time Parameters Summary Parameters Readiness Parameters
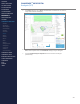
8. Choice of Selected Sessions, and Filter Sessions By are optional - these
can be selected when editing the widget once it is on your dashboard.
Use the Filter Sessions By elds to narrow down the Available Sessions
list.
9. Double-click on a session in the Available Sessions list to move it to
Selected Sessions. Use the blue X in the selected session to remove if
needed.
10. Use the Save As button to save as a widget. It then becomes available
when adding widgets to the Home screen dashboard.
CONTENTS
ABOUT THIS MANUAL
GETTING STARTED
SYSTEM OVERVIEW
SYSTEM SETUP
LIVE OPERATIONS
ANALYSIS OPERATIONS
ANALYSIS IMPACT
PROCESSING
ANALYSIS REPORTS
LOG DATA
OMNISENSE
TM
WEB PORTAL
> Overview
> Home Screen
> Default Widgets
> Custom Widgets
> My Prole
> Live Screen
> Analysis
> Reports
> Calendar
> Devices
> Teams
> Athletes
> Manage User Roles
> Manage Users
> Training Plans
> Preferences
> Threshold Settings
OMNISENSE
TM
MOBILE
OMNISENSE
TM
TOOLS
BASELINE FITNESS TESTING
FITNESS PARAMETERS
APPENDICES
EULA
SUPPORT
INDEX