
User Guide
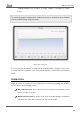
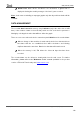


Table Of Contents
- Contents
- Document updates
- 1 Introduction
- 2 Configuration
- 2.1 General
- 2.2 Display
- 2.3 Inputs
- 2.4 Thermostat n
- ANNEX I. Video Intercom Operation
- ANNEX II. Internal Call Operation
- ANNEX III. Remote Control via IP
- ANNEX IV. Graphs
- ANNEX V. Differences with Z50 / Z100
- ANNEX VI. Communication Objects

Z50 / Z70 v2 / Z100
https://www.zennio.com Tecnical Support: https://support.zennio.com
141
enabling/disabling each checkbox. A simple example of navigation is shown
below:
To access the graph of 29 April 2022, it will be necessary to uncheck the time checkbox
and set 29 April 2022 by using the arrows.
Figure 138. Graph panel
For more precise information, a tooltip will be displayed when clicking on any of the
recorded data. The exact time of the received data and the recorded value are indicated
inside.
ZOOM LEVELS
Within the panel it is possible to access different zoom levels by enabling and disabling
the checkboxes in the navigation area:
Day and hour levels: these two levels show the data recorded with a zoom
level of one day or one hour.
Month and year levels: these two zoom levels show the averages, maximums
and minimums of the data recorded each day or each month.