
User Guide
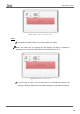

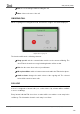

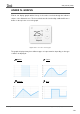
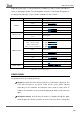
Table Of Contents
- Contents
- Document updates
- 1 Introduction
- 2 Configuration
- 2.1 General
- 2.2 Display
- 2.3 Inputs
- 2.4 Thermostat n
- ANNEX I. Video Intercom Operation
- ANNEX II. Internal Call Operation
- ANNEX III. Remote Control via IP
- ANNEX IV. Graphs
- ANNEX V. Differences with Z50 / Z100
- ANNEX VI. Communication Objects

Z50 / Z70 v2 / Z100
https://www.zennio.com Tecnical Support: https://support.zennio.com
140
Depending on the type of control parameterised, it will be possible to enable or disable the
option of displaying its graph. The following table shows the controls that allow graphs to
be displayed and the type of representation available for each of them:
Type of control
Function
Type of representation available
Indicator
Binary
Switching graph
Integer
Line graph [curve/straight/step]
Percentage
Line graph [curve/straight/step]
Float
Line graph [curve/straight/step]
Temperature
Line graph [curve/straight/step]
1-Button Control
Switch
Switching graph
Two Objects (Short Press/Long
Press)
Switching graph
2-Button Control
Switch
Switching graph
Switch + Indicator (counter)
Switch + Indicator (scaling)
Switch + Indicator (float)
Switch + Indicator (temperature)
Line graph [curve/straight/step]
Line graph [curve/straight/step]
Line graph [curve/straight/step]
Line graph [curve/straight/step]
Two Objects (Short Press/Long
Press)
Switching graph
Counter
Line graph [curve/straight/step]
Scaling
Line graph [curve/straight/step]
Float
Line graph [curve/straight/step]
Shutter
Line graph [step]
Dimmer
Line graph [step]
Climate Control
Temperature Setpoint
Line graph [Setpoint: step; Real: curve]
Fan (Scaling)
Line graph [step]
Table 10 Controls allowing graphs
GRAPH PANEL
The graph panel has the following elements:
Graph: this will be the main element where the recorded data is displayed. The
x-axis will correspond to the period shown and the y-axis will be adjusted
depending on the maximum and minimum value shown in that period. In
addition, the information of the period being displayed will be shown at the top
right.
Navigation buttons: at the bottom, the buttons to navigate through the graph
will be displayed to select the period to be shown. The zoom level is changed by