
User Guide
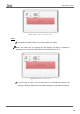

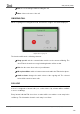
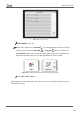

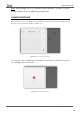
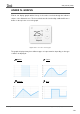
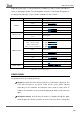
Table Of Contents
- Contents
- Document updates
- 1 Introduction
- 2 Configuration
- 2.1 General
- 2.2 Display
- 2.3 Inputs
- 2.4 Thermostat n
- ANNEX I. Video Intercom Operation
- ANNEX II. Internal Call Operation
- ANNEX III. Remote Control via IP
- ANNEX IV. Graphs
- ANNEX V. Differences with Z50 / Z100
- ANNEX VI. Communication Objects

Z50 / Z70 v2 / Z100
https://www.zennio.com Tecnical Support: https://support.zennio.com
139
ANNEX IV. GRAPHS
Z70 v2 can display graphs with a history of the values received through the indicator
objects of the different boxes. The boxes that have this functionality enabled will have a
button on the top left to access the graph.
Figure 137. Control with enabled graph
The graphs displayed may have different types of representation depending on the type
of data to be displayed:
Switch:
Curve:
Straight:
Step: