
User manual


InZennio Z41
http://www.zennio.com Tecnical Support: http://zennioenglish.zendesk.com
39
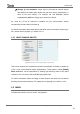
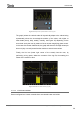
Figure 33 Graphical representation of the log file
The graph (where the vertical scale will dynamically adapt to the values being
represented) shows the chronological evolution of the value, with higher or
lower detail (hourly, daily, weekly, monthly; see Figure 34) depending on the
zoom level set by the user by means of the on-screen magnifying glass control.
In the case of the lower detail levels, the graph will show the average values per
time unit (day or month) as well as the maximum and minimum values.
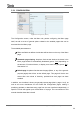
Finally, the bin icon (lower right corner of the screen) lets the user, by
performing a long press, delete the contents of the log file, thus setting the
values of the monitor to zero.
Figure 34 Different detail levels (log file)
3.4.2.2 1-BUTTON CONTROL
Boxes configured as 1-button controls show one centred button and a title.