
Operation Manual


Z41 Pro
http://www.zennio.com Tecnical Support: http://support.zennio.com
69
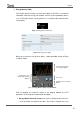
Evolution of the Power Consumption object: shows, as a graph, the
chronological evolution of the value of the power object ([Energy x]
Power). The horizontal axis will show different time lapses (hours, days, or
months), depending on the selected zoom level.
Instant Value of the Energy, CO
2
and Cost objects: indicator that,
depending on whether the Energy consumption, CO2 and Cost
parameters have been enabled, will show the current value of, respectively,
the [Energy x] Energy, [Energy x] CO2 and [Energy x] Cost objects.
Zoom Level: two-button control that lets the user change the time scale, so
more / less detail is shown in the graph of the evolution of the power object.
The behaviour and the representation of the data are similar to those of the
numeric data log (see epigraph e) in section 3.4.2.1).
Validation / Refresh / Reset buttons: permit, respectively, closing the pop-
up window, sending a reset order (value “1” through the [Pn][Bi] Energy
Monitor: Reset object) and requesting an updated consumption report
(value “1” through the [Pn][Bi] Energy Monitor: Request object).
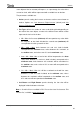
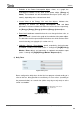
d) Daily Timer
Figure 74 Daily Timer
Boxes configured as daily timers let the final user program a timed sending of a
value to the bus, being possible to send binary or scene values (according to
the parameterisation) at a certain time (either every day or only once) or at the
end of a countdown.
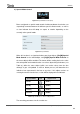
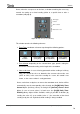
Figure 75 Daily Timer (Box)
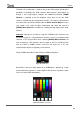
Binary value to be sent, or
“Scene” icon