Y S I I N C O R P O R AT E D DATA S C O U T A DVA N C E D Software for the Level Scout OPERATIONS MANUAL
CONTENTS Contents ................................................................................................................................................................................. i 1.0 Product Introduction ......................................................................................................................................................1 1.1 Data Scout Advanced..................................................................................................................
.4.1 Site Network Maintenance Functions .........................................................................................14 3.4.2 Overall Data Scout Advanced Funtions.......................................................................................14 3.5 The Configure Functions ...............................................................................................................................16 3.5.1 Configuring The Transducer Site Network...........................................
5.0 Testing Transducers.......................................................................................................................................................63 5.1 The Execute Script window’s Controls..........................................................................................................63 5.1.1 Script Form’s Command (Script) File Selection Frame .............................................................64 5.1.2 Script Form’s Log File Selection Frame ...................
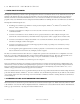
1.0 PRODUCT INTRODUCTION 1.1 DATA SCOUT ADVANCED This Operations Manual is provided for an in depth explanation of Data Scout Advanced software for use with YSI Level Scouts. In addition to this manual, the Level Scout Support CD includes a Level Scout manual which describes basic Data Scout Advanced functions, and a Data Scout manual which describes how to use a Level Scout with Data Scout and Data Scout Mobile software programs.
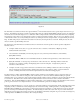
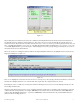
Figure 1.0 The main Data Scout Advanced window has a typical Windows® menu bar and status bar at the top and a single visual control (e.g., a button). The middle of the window contains a spreadsheet-like table, also called the Site Net Map. It displays Level Scouts defined for the current site network. Each displayed “row” of this table defines a single transducer and shows all the data obtained by configuring and querying it. These data rows are listed under a header row with various labeled columns.
Figure 1.1 When exiting Data Scout Advanced, the current site’s definition (including ID information if already read from each transducer) is automatically saved in a default site net file (DSAdv.net). This “latest” site net is restored automatically the next time Data Scout Advanced is started. Menu sub-items on the File menu allow the user to create, save, and/or open other explicitly named site nets (.net files).
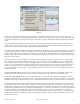
Figure 1.3 Functions are selected from the Configure drop down menu located in the main menu bar at the top of the window (figure 1.3), or selected from a “hidden” Site Net Map context menu that will open when the user right-clicks over any row of the Site Net Map. This context menu duplicates the most frequently-used site-network-editing, querying, and diagnostic functions available from the main menu.
The last menu bar item, labeled Help, provides a submenu leading to four help features of Data Scout Advanced. These provide quick tips on using Data Scout Advanced features, access to the Data Scout Advance Operations Manual, access to the YSI web site, and show the current version of Data Scout Advanced. In addition to this Help menu, do not forget the many ToolTips available. Similar MenuTips appear in a status box at the bottom of the window.
This will load the Windows® SETUP program, which guides the user through the remainder of the installation process. After installation, Data Scout Advanced can be executed via the Windows® Start menu by selecting Start | Programs | Data Scout Advanced | DSAdv. 2.1.1 INSTALLING DATA SCOUT OPERATIONS MANUAL The CD labeled Level Scout Information and Support contains the Data Scout Advanced Operations Manual as a .pdf. The file name is DSAdv_605815C2.pdf The user can access the .
This optional variation of the command refuses to execute if more than one transducer is currently defined on the Site Net Map. The “normal address” variation works at anytime for any single highlighted transducer.
Each transducer should respond correctly to its address, after which it is automatically added to the Site Net Map. Do not click the Stop button until the auto-discovery process has found each transducer and added its row to the map. Use Query button to verify that the new transducer is working correctly. Be sure to use the File | Save Site Net As command to give the new working site network a unique name. This will allow the user to Open it later.
to ALL the transducers assigned to the Run window. Click Cancel to only view the current unit selection or to close the window without saving the changes. 2.5.2 CHANGING TEMPERATURE UNITS IN TRANSDUCER(S) Use the same procedure detailed in the previous section, but select the Run window’s menu item Configure | Temperature Units (HiLi Xdcr) instead. Temperature units will be displayed (for highlighted transducer).
Folders. To avoid typing in a full path name, double-click this text box, and a dialog window opens allowing the user to specify a particular drive and folder path. Finally, press OK on the configuration window to save the new path name. Please note that the user is specifying only the Base path of the Archive subfolders. No particular subfolder or file name should be included in this path name, as these will be added later in the proper context.
3.1 FREQUENTLY USED TERMS AND ABBREVIATIONS The word transducer is abbreviated xducer (or xdcr) on all Data Scout Advanced windows, menus, and ToolTips. The abbreviation , or transducer number, is used to uniquely identify each transducer line (or row) on the Site Net Map of the main Data Scout Advanced window and as a shorthand name for that transducer in certain reports and logs. It is not a characteristic of the transducer itself.
gives the protocol, communication port setup parameters (in parentheses), and the full path name of a Site Net (.NET) file that defines this collection of parameters. If the user has modified these parameters (and has not yet saved them) the path name is replaced by (modified - unsaved). A MenuTips status bar at the bottom of the window shows the purpose of the last menu item selected whether it was executed fully or not. It compensates for menus not having any ToolTips.
The Query function in the context menu is the same “read ID string” function performed by the Query button for all defined transducers on the site network but is performed only for the highlighted transducer(s). Other transducer/row editing functions are also found in the first section of this context menu. Like the Query function, the Delete function may also be performed for more than one highlighted transducer while the others can only be performed for a single highlighted transducer.
3.4 THE FILE MENU FUNCTIONS The File menu selection, on the main menu bar, leads to a two-section submenu containing four “site network maintenance” functions and three “overall” Data Scout Advanced functions (figure 3.4). Figure 3.4 3.4.1 SITE NETWORK MAINTENANCE FUNCTIONS The main purpose of the Site Net Map is to show information about each Level Scout defined on the current site network after querying it. See section 3.3 for more information.
For new Data Scout Advanced installations, it is also used to copy files from an old installation. The archive window contains two identical frames of controls. The first frame displays folders, filters, and their files from the Main Base Path (i.e., where Data Scout Advanced is installed, and where Data Scout Advanced keeps its main data files in subfolders).
the default file DSAdv.net. This file’s site net will be restored by default if Data Scout Advanced is restarted. In some cases, Data Scout Advanced may refuse to exit until the user has manually ended some important task still in progress. In this case, a red text message appears in the status bar. Before exiting Data Scout Advanced, if changes have been made to the site net, the user may want to save it with an explicit name by using the File | Save Site Net As function first. 3.
3.5.1 CONFIGURING THE TRANSDUCER SITE NETWORK The Configure | Xducer Site Network menu function (or clicking the label that describes the site net parameters, just below the Query button) opens the following window: Figure 3.7 In this example one or more Level Scout transducers, utilizing SDI-12 protocol, are connected to communication port 1 at 19200 baud. The Protocol should always be set to SDI-12. The Use Brk/Mrk checkbox is normally checked.
Leave the Modem Used check box unchecked if using a local hard-wired site network of one or more transducers connected to a hardware serial port (e.g., COM1). However, if the Site Network is remote (connected via some transmission medium using one or more modems), then check this box. When checked, two additional text boxes appear (figure 3.8). Figure 3.8 The text box labeled Tel.No./IP/DNS identifies some address by which a remote modem can be located when Data Scout Advanced starts.
Note YSI has tested two cell phone devices with the following results. The AirLink Raven modems (GSM or CDMA) have remote serial ports (which connect to the remote Level Scout transducer(s)) that can have their serial port communication parameters set only statically by sending manual AT modem commands. The serial parameters do not get dynamically relayed to the remote serial port on the remote modem when Data Scout Advanced sets them for its local “virtual” port.
There are only four General Options in this selection. All these persistent options are remembered in the DSAdv.ini file when saved (i.e. when Data Scout Advanced is closed). The first three options many be entered by clicking its text box and typing in a full path name (including a file name for the first two options, but not the last).
000004.614749 : 000.004809 000004.621342 : 000.006593 000004.623733 : 000.002391 000004.733513 : 000.109780 000004.738575 : 000.005062 000004.848199 : 000.109624 000004.853304 : 000.005105 000004.860490 : 000.007186 000004.862843 : 000.002353 000004.972907 : 000.110064 000005.091869 : 000.118962 000005.102893 : 000.011024 000005.213892 : 000.110999 000005.219357 : 000.005465 000005.226470 : 000.007113 000005.229060 : 000.002590 000005.236519 : 000.007459 000005.339145 : 000.102626 000005.454689 : 000.
The Add function is used to add a new row to the end of the current Site Net Map. In figure 3.10, the title bar of the window indicates that Transducer #1 was previously the last item on the map, and that this function, if completed, will add a new Transducer #2 to the end of the map. Figure 3.10 The Add function’s window has two fields where entries are possible for the transducer (i.e., the light-green fields).
3.5.4 CONFIGURING OTHER OPTIONS OF THE HIGHLIGHTED TRANSDUCER The bottom section of the Configure submenu has two transducer network maintenance items. The first function called Configure | Who Are You? (Only Xdcr) will request that the only transducer on the network report its unknown address. This is accomplished by transmitting a special broadcast command (i.e., one without a specific address).
3.6 THE RUN FUNCTION The Run menu has three functions (figure 3.14). Figure 3.14 All items will take the user to the Run window which provides a data acquisition and recording function of Data Scout Advanced as a single-cycle (on demand), periodic, or continuous data acquisition from all (or selected) transducers on the Site Net Map. The window has many transducer configuration functions that read (and optionally set) various options inside individual transducers currently defined on the map.
3.7 THE TEST FUNCTION The Test function, selected from the Data Scout Advanced main menu leads to a sub-menu with only one item (figure 3.15). Figure 3.15 The Execute Script function is available to users who are familiar with the use of low-level transducer commands and responses.
3.8.1 HELP TIPS The Help | Tips function displays a window that summarizes information about various Data Scout Advanced Help features (figure 3.17). The first panel contains information about ToolTips in general. The middle panel describes all the major main Data Scout Advanced window menu bar items. The last panel describes ways of obtaining the Data Scout Advanced Operations Manual Figure 3.
3.8.2 HELP ACCESS TO OPERATIONS MANUAL The Help | Manuals menu opens the full text and color illustrations of the complete Data Scout Advanced Operations Manual. Before this works, Data Scout Advanced must be configured to find the manual (section 2.1.1) 3.8.3 HELP ACCESS TO YSI WEB SITE The Help | Website menu provides access to the YSI website. Use this selection to get the latest published information on the Level Scout. 3.8.
original transducer’s Adrs field is replaced with the new address for the new transducer. After this, simply Query again to read all the information from the new transducer. If there are multiple transducers on your Site Net, then it is necessary to perform the ‘File | New’ function from the “main” menu instead. You must click the Auto Disc button, follow all the prompts carefully, and then wait for all transducers to be recognized.
For the All Transducers sub-menu item, there is no need for any transducer to be highlighted on the Site Net Map of the main window since the term ‘All’ means all working transducers. However, if any transducers on the main Data Scout Advanced window are not yet working (i.e., have not been successfully queried to fill in their necessary ID string information) they will not show up on the Run window until they are working.
eventually displayed there (e.g., pdat for pressure data, pun for pressure units, etc.). When the Acquire function is started, these table cells are updated with actual “live” data. An alternate Plot display method for displaying acquired data may be selected instead of (or in addition to) the Table display. The Plot display causes a large rectangular graphic window to hide the display table although its Xdcr. column always remains to allow individual transducer rows to be selected by clicking them.
The user must then click OK on this status window to dismiss it, and then click Off in Acquire frame, before the Run window can successfully Exit. A similar warning occurs if the user tries to Exit too quickly before Run completes its one-time startup initialization period. 4.2.2 RUN WINDOW’S ACQUIRE MENU AND CONTROLS The Run window’s Acquire menu has four sections (see figure 4.5). Figure 4.5 The top two sections contain functions that control the “live” acquisition and display cycle of the Run window.
Either will allow the user to edit the text box directly, after which the user must press (or click outside the text box) to make the change effective. NOTE: A non-zero Acquire Period value (in seconds) that is less than the time it takes to actually make a complete scan of all selected measurements will result in a nearly continuous scan. A small pause between scans, with the Scan Count box displayed briefly yellow (200 msec), indicates this.
In figure 4.9, the Run window is shown with only a single measurement (P) selected. Here, the continuous “live” acquisition cycle (with fastest possible scan period = 0) is shown in progress (i.e., count box = 3.1 and bright green) the count indicates that the 3rd scan, 1st (and only) measurement, is in progress. Since there is only one measurement, the fractional part of the scan counter never changes when the box is green.
A separate frame of visual controls in the Run window, labeled Display, has all the exact same functions, but with ToolTips. The lightgreen list box shows the currently selected Display type, and its right arrow button allows the user to select a new type from a dropdown list. Selecting the Options button in this frame causes an auxiliary Display Options window to open (figure 4.11).
NOTE: The Xdcr. column (of the original Table display) remains exposed (on the left) when a plot display pane appears on top of it. This allows individual transducers to still be selected (by clicking their row) which is required to perform various other transducer-specific Configure menu functions of the Run window. Clicking a row is also used to select the scope of a Trend plot: either a single transducer’s measurements or data from all transducers plotted together (by clicking the bottom blank row).
Clicking the Scales button on this window reveals other advanced options for overriding plot scale end-points normally chosen automatically (figure 4.14). Clicking the Options button (on right) will restore the original second frame of main options. Once any Scale End-Points have been edited they will persist until the Plot format is reselected for the display which restores the original “automatic” scale end-points.
Figure 4.15 Figure 4.
The only significant option difference is the addition of a slider control that allows the delay between successive tabular display updates to be varied. However, this is only useful for displaying AutoLog data (described later). The other Plot options are the same as for the Plot-Only Trend graph. The original Table Display type on the Run window can only be resized in the horizontal direction though its various tabular display columns can be narrowed or widened by dragging their header boundaries.
effective. Any name is permitted as long as it can be part of a valid Windows® file name. If the name is left blank, then the next recorded data file name will begin with an underline character followed by the and
To make it easier to find and use these functions, a visual control frame labeled AutoLog appears in the Run window to integrate all these functions in one place (figure 4.21). Figure 4.21 Note: A particular transducer row in the Xdcr. column of the Run window’s must be selected (highlighted) before selecting any of these AutoLog buttons (or menu equivalents), as these functions focus only on a single Level Scout.
4.2.5.1 CREATING AND EDITING AUTOLOG TESTS The Edit Tests button lets the user Configure (define and/or edit) one or more tests that can be defined in the selected transducer. Clicking this button opens the AutoLog window open (figure 4.22). This window permits the user to view and/or edit any or all of the AutoLog tests (numbered 1 - 16) that are defined inside the selected Level Scout. Figure 4.
Measure: Specify any or all measurements to be logged: transducer level or pressure (P), transducer temperature (T), printed circuit board temperature (B), and battery voltage (V) Other: Give tests an optional name (up to 18 chars.) or Vacate any Idle or Done test. The program will warn the user to extract the data from Done tests before vacating them. The Time tab contains options for entering the Begin and End date/times of a new test, or for displaying the date/times of an existing test (figure 4.
The Scan tab accepts a relative time Period (in days, hours, minutes, and seconds, between the starts of each scan) and a Scan Type selection for a test (figure 4.24). The most common Scan Type is Linear, meaning that the scans are evenly spaced in time at a fixed constant period. The period has a days field that can be specified as 0-99 days. The seconds field of the period may have a fractional part allowing it to vary from 0 to 59.99 seconds.
The Measure tab allows the user to select any or all of the available measurements (pressure, transducer temperature, printed-circuitboard temperature, or supply voltage) to be made for each acquired scan of the test (figure 4.28). The supply voltage always measures the internal battery voltage even if external power is supplied. Simply check the check-box corresponding to each desired measurement to include it in each logged scan. Figure 4.28 The Other tab (figure 4.
On the right side of the Edit Tests window, below the four parameters tab, there may be several different special buttons visible, depending on the state of the selected test. If the selected test is Active then a single button labeled End Active Test is visible. In this Active state, the only test parameter that can be changed via the editing process is the End Time of the test. All other parameters are dim and unchangeable.
4.2.5.2 EXTRACTING DATA FROM AUTOLOG TESTS To Extract AutoLog data from a Level Scout, click (highlight) a particular transducer row on the left-most (Xdcr.) column of the Run window to choose the subject transducer. Then, click the large Extract Test Data button in the AutoLog frame. Clicking this button makes the AutoLog window open (figure 4.30).
All extract requests and option changes on the Data tab turn “pink” just like test parameter changes using the Edit Test function. Changed fields on the Unit tab do not turn pink since they are simple modifiers of the extract requests on a per test basis. All extracted AutoLog pressure/level data coming from a Level Scout are downloaded to the PC in fixed units (psi pressure units, degC temperature units).
Although there are special options in the first frame of the Display Options window (figure 4.32) to allow the speed of the Table update to be slowed down, and repeatedly displayed, the Plot form of display may be preferred for displaying extracted AutoLog data. Figure 4.32 The first check box in figure 4.32 (labeled Display AutoLog Data During Extraction) is normally checked. It causes AutoLog data to be displayed at the time it is extracted and whenever any AutoLog Test Data (.
The preferred Display type for AutoLog data is Plot. Once displayed as a plot, the user may increase the window’s size (and thus the plot surface) in both height and width by dragging the bottom-right corner of the Run window. Also, notice the particular Plot Option frame in figure 4.33. Open this window by selecting the Scales button in the previous window (figure 4.32).
The list box labeled Files of type: may have its arrow button clicked to select another filter (e.g., to view all the .csv files instead). A selected .csv file is best viewed by a spreadsheet application directly using the Open item on the right-click context menu instead of clicking the Open button or double-clicking its file name. Any AutoLog Test Data (.atd) file selected for viewing will be displayed on the Run window according to the currently selected display mode (Table, Plot, or Both).
Notice the three options in the frame of controls located at the upper left of this window. Although the Other function you chose from the Run window is currently selected, two other configurations (functions) can also be chosen at any time. These were already described in section 4.2.5.1 and section 4.2.5.2.
WARNING: Broadcast messages can interfere with the normal SDI-12 commands/responses sent/received by Data Scout Advanced. The only safe thing to do after enabling broadcasts is to remain in the Run window without trying to execute any other menu operations that would send commands. If a test in the Level Scout is also active the broadcast messages generated will be trapped and printed in the main status bar of the Run window.
4.2.6 RUN WINDOW’S CONFIGURE MENU FOR TRANSDUCER OPTIONS The Run window’s Configure menu reveals four sections (figure 4.36). All items require that the user select (highlight) a particular transducer # on the Run window’s data display first. This will choose which transducer to read to find a particular selected option’s current value. Figure 4.36 These submenu sections contains transducer configuration functions that allow the user to change various options (e.g.
The Configure | Field Offset (HiLi Xdcr) menu item opens the following dialog window: Figure 4.37 The text box of this dialog window contains the current value of the Field Offset that was just read from the transducer. See its ToolTip for more information. Click the text box to edit the original value shown and enter the correction factor you wish to change it. Please note, the value of the Field Offset option always appears in psi units for viewing.
The Averaging form specifies an averaging time in seconds (in the range 0 to 24). However, the time entry translates directly into an equivalent sample count also shown in a un-editable text box. Setting a time of 0 seconds disables all averaging (i.e., set # of samples to 1). The value in the light green text box shows the current value of this option that was just read from the transducer. Click the text box to edit the current value shown if you wish to change it.
The Configure | User Units (HiLi Xdcr) menu item opens the following window: Figure 4.42 The two text boxes of this dialog window contain the current values of the Offset and Slope options, respectively, for defining User Units data read from the transducer. See their ToolTips for more information. Click either text box to edit its original value and then click OK to change it.
The Configure | Lock Access (HiLi Xdcr) menu item opens the following window: Figure 4.44 The current Locked/Unlocked State of the Level Scout is indicated by the option button selected. Select the desired Locked/Unlocked State by clicking the corresponding option button and then click OK to change it. NOTE: The following menu items (located in the second section of the Configure menu) will not function unless the affected transducer is Unlocked.
NOTE: Changing the baud rate in a remote transducer is not possible with every cell phone modem. YSI has tested the Digi Connect Remote Gateway (RG) device (with integral RealPort virtual serial port driver) and found it capable of baud rate change. The AirLink Raven modem can only have its serial port communications parameters set statically by AT commands. This makes it incapable of using the configuration command shown above to change baud rate.
Figure 4.48 Since these coefficients can only be viewed, clicking OK will cause a Beep (or Bell) to sound indicating that the coefficient was not changed. Select Cancel when finished viewing a particular coefficient’s current value. When the above window is closed, the previous coefficient selection window is then repeated. Select another single coefficient to view or select Cancel if finished viewing coefficients. The Configure | Sleep Mode (HiLi Xdcr) menu item opens the following window: Figure 4.
The Configure | Zero (HiLi Xdcr) menu item is the first item in the next menu section. It opens the following window: Figure 4.50 NOTE: It is important that the vent tube of each affected vented Level Scout be exposed to atmospheric pressure when this function is executed. Also, no pressure can be applied to the affected transducer(s) when this function is executed unless you wish that pressure to subsequently read zero.
4.2.7 RUN WINDOW’S TRANSDUCER FIRMWARE UPDATE FUNCTION The Configure│Update Firmware menu item opens the following window: Figure 4.51 The window has a frame labeled Apply to: that allows the user to update firmware in only the selected transducer, or in all transducers assigned to the Run window. If the Level Scout is locked a warning window will open. Normally, select OK and then use the Run window’s Configure menu to Unlock the transducer before selecting the Upgrade Firmware function again.
Date/Time Difference displayed should be approximately the time it took to accomplish the firmware upgrade before the transducer was reset (and its new firmware started). Select the box labeled Synchronize Xducer(s) with PC in the Date/Time frame, then click the Send button to synchronize the two clocks. After performing this function, the time difference displayed should be between 0:0:0 and -0:0:2 seconds. If this time lag is outside this range, repeat the synchronize operation.
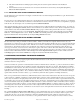
5.0 TESTING TRANSDUCERS This chapter details the Test functions available to typical users. There is one Execute Script function available. Chapter 3 described how to activate this function from the main Data Scout Advanced window’s Test menu. Here the separate Execute Script window (with its own unique visible and hidden controls) is described in its fullest functional detail with pictures and examples. For details on writing custom Scripts (also called Command files) see Appendix C. 5.
5.1.1 SCRIPT FORM’S COMMAND (SCRIPT) FILE SELECTION FRAME The first frame of controls is labeled Script File To Execute: and its File Name: text box is initially empty. The pale yellow status box (in the third frame) will contain an initial prompt message indicating the need to select a script first. The frame also contains a View/Edit button and a Browse button.
In the example above, there are two existing script (.cmd) files shown in the larger white directory box. Click any file name to highlight it, and then press the Open button to select it. You can also enter a new script file name (e.g., new.cmd) directly in the File name: box below the directory box, and then click Open. The new file need not exist. Either way, the dialogue box will close and the full path name of the file selected (or entered) will appear in the File Name: text box on the form.
script’s execution (they show the latest executed command, and latest received response, respectively). Each has a normally-check option check box. Uncheck these options if you do not wish these status boxes to be used to indicate the current state of command execution. To start executing the Script file click the Execute button. The button will be then be renamed Abort Script to stop it.
in the Transducer Net Map. If more than one transducer is defined on the Transducer Net Map, the Script has a loop that will repeat for each transducer. In this particular example, however, there was only a single transducer defined thus the loop terminated after one iteration. The Script file uses many short comment lines (') to separate one command from another making it longer than necessary but easier to read. The Log file that follows was created when this Script file was executed.
(#x)D0 ' (#x)M5 Wait PrvRspSec (#x) (#x)D0 ' (#x)M6 Wait PrvRspSec (#x) (#x)D0 ' (#x)C Wait PrvRspSec (#x)D0 ' (#x)C0 Wait PrvRspSec (#x)D0 ' (#x)C1 Wait PrvRspSec (#x)D0 ' (#x)C2 Wait PrvRspSec (#x)D0 ' (#x)C3 Wait PrvRspSec (#x)D0 ' (#x)C4 Wait PrvRspSec (#x)D0 ' (#x)C5 Wait PrvRspSec (#x)D0 ' (#x)C6 Wait PrvRspSec (#x)D0 ' (#x)U OPEN (#x)XR+0 Wait PrvRspSec (#x) (#x)D0 (#x)XR+1 Wait PrvRspSec (#x) (#x)D0 (#x)XR+2 Wait PrvRspSec (#x) (#x)D0 (#x)XR+3 Wait PrvRspSec (#x) YSI Incorporated Data Scout Advance
(#x)D0 ' (#x)XR+22 Wait PrvRspSec (#x) (#x)D0 (#x)XR+23 Wait PrvRspSec (#x) (#x)D0 (#x)L ' (#x)XT+5 Wait PrvRspSec (#x) (#x)D0 ' LOOP2 2 ' (#x)XT+0 Wait PrvRspSec (#x) (#x)D0 ' AddTo x 1 LOOP1 Wait 0 When the Script (Command) file above is executed, it generates the following Log file. This Log file example was created when the Execute Script window had all possible options enabled thus the file is quite long. -- DSAdv 'Execute Script' Log File, for script: C:\YSI\DSAdv\Cmd-Log\SdiROTest.
Rsp<0015>: _0U OPEN!0__ ' Rsp Data(>!): 1= Cmd<0016>: (#x)XM+1 ' Expanded Cmd: 0XM+1 (Measure Raw Temp./Press.Volts)+(SR) Rsp<0016>: _0XM+1!0005 ' Rsp Data(>!): 1= 2-4= 5= Cmd<0017>: Wait PrvRspSec ' Waiting for 5 seconds Rsp<0017>: Wait began at 14:31:06 and ended at 14:31:11 Cmd<0018>: (#x) ' Expanded Cmd: 0 (Read SR=Service Request) Rsp<0018>: 0__ ' Rsp Data(>!): 1= (SR) Cmd<0019>: (#x)D0 ' Expanded Cmd: 0D0 (Read Data) Rsp<0019>: _0D0!0+0.525487+0.
Cmd<0048>: (#x) ' Expanded Cmd: 0 (Read SR=Service Request) Rsp<0048>: 0__ ' Rsp Data(>!): 1= (SR) Cmd<0049>: (#x)D0 ' Expanded Cmd: 0D0 (Read Data) Rsp<0049>: _0D0!0+1.000000+0.000000-0.033854__ ' Rsp Data(>!): 1=+++ Lin<0050>: ' Cmd<0051>: (#x)M4 ' Expanded Cmd: 0M4 (Meas. Cal. Coeffs.
Rsp<0080>: _0D0!0+23.000+0__ ' Rsp Data(>!): 1=++(unitx:0=degC,1=degF) Lin<0081>: ' Cmd<0082>: (#x)C3 ' Expanded Cmd: 0C3 (Meas. User Coeffs.) Rsp<0082>: _0C3!000103__ ' Rsp Data(>!): 1= 2-4= 5-6= Cmd<0083>: Wait PrvRspSec ' Waiting for 1 seconds Rsp<0083>: Wait began at 14:31:42 and ended at 14:31:43 Cmd<0084>: (#x)D0 ' Expanded Cmd: 0D0 (Read Data) Rsp<0084>: _0D0!0+1.000000+0.000000-0.
Rsp<0112>: Wait began at 14:31:55 and ended at 14:31:56 Cmd<0113>: (#x) ' Expanded Cmd: 0 (Read SR=Service Request) Rsp<0113>: 0__ ' Rsp Data(>!): 1= (SR) Cmd<0114>: (#x)D0 ' Expanded Cmd: 0D0 (Read Data) Rsp<0114>: _0D0!0+15+16777216__ ' Rsp Data(>!): 1=++ Lin<0115>: ' Cmd<0116>: (#x)XR+22 ' Expanded Cmd: 0XR+22 (Read Coefficient)+(SR) Rsp<0116>: _0XR+22!00012__ ' Rsp Data(>!): 1= 2-4= 5= Cmd<0117>: Wait PrvRspSec ' Waiting for 1 seconds Rsp<0117>: Wait beg
Rsp<0146>: Wait began at 14:32:09 and ended at 14:32:15 Cmd<0147>: (#x) ' Expanded Cmd: 0 (Read SR=Service Request) Rsp<0147>: 0__ ' Rsp Data(>!): 1= (SR) Cmd<0148>: (#x)D0 ' Expanded Cmd: 0D0 (Read Data) Rsp<0148>: _0D0!0-0.04439+11__ ' Rsp Data(>!): 1=++ Lin<0149>: ' Cmd<0150>: (#x)M0 ' Expanded Cmd: 0M0 (Meas.
Rsp<0178>: _0D0!0+23.921+0__ ' Rsp Data(>!): 1=++(unitx:0=degC,1=degF) Lin<0179>: ' Cmd<0180>: (#x)M6 ' Expanded Cmd: 0M6 (Meas.
Rsp<0211>: _0D0!0+24.085+0__ ' Rsp Data(>!): 1=++(unitx:0=degC,1=degF) Lin<0212>: ' Cmd<0213>: (#x)C6 ' Expanded Cmd: 0C6 (Meas. Excitation Voltage) Rsp<0213>: _0C6!000201__ ' Rsp Data(>!): 1= 2-4= 5-6= Cmd<0214>: Wait PrvRspSec ' Waiting for 2 seconds Rsp<0214>: Wait began at 14:33:16 and ended at 14:33:18 Cmd<0215>: (#x)D0 ' Expanded Cmd: 0D0 (Read Data) Rsp<0215>: _0D0!0+12.
Cmd<0243>: (#x)L ' Expanded Cmd: 0L (Lock Xducer) Rsp<0243>: _0L!0__ ' Rsp Data(>!): 1= Lin<0244>: ' Cmd<0245>: (#x)XT+5 ' Expanded Cmd: 0XT+5 (Add Add'l.
6 . 0 P RO C E S S I N G L E V E L S C O U T DATA F I L E S ( D S P L AY ) 6.1 THE PLAYBACK FUNCTION This chapter details the Playback function. It is used for viewing, editing, converting, and creating final presentation reports and graphic plots from any data file that was generated by Data Scout Advanced. Such files are normally stored in the default path C:\YSI\DSAdv\Dat.
When started, the DSPlay window appears as a one of three blank windows, depending on its currently selected Display mode (figure 6.1). Figure 6.1 The Text Box Display has scroll bars in case the selected file being displayed does not fit exactly into the box. However, the entire DSPlay window can also be resized and repositioned on the screen. The application remembers these parameters persistently when it exits. When restarted it restores the saved position and size it previously had.
You can always start DSPlay by selecting a new file, via the File | Open menu item, which causes the Windows® File Open dialog window to open. This selected file then becomes the new last file selected. If a last file selected exists, its full path name also appears (highlighted) in the File name: list box. The user may re-select it immediately by clicking the Open button on the dialog window. Its file type also selects a current filter in the Files of type: list box.
Clicking the white display area of the text box causes the following configuration window to open. As can be seen, there are currently no options for this display mode. Figure 6.3 6.1.1.2 DISPLAYING FILES AS GRAPHS Examples of the graphic plot display formats are shown below. Display options vary with the type of file (AutoLog or Record) being plotted. Please note that the font size used for annotating a graph is quite small and may seem crowded in these plot examples.
Clicking the display area of the plot surface causes a main plot configuration window to open if an AutoLog file (.atd or .csv) is selected for display (figure 6.5). Select the Scales button to open the Scales window (figure 6.6). Selecting the Options button restores the main window. Explore the ToolTips of both these windows for information on the purpose of each option frame, field, and button. Figure 6.5 Figure 6.
The Scales window (figure 6.6) displays the automatically determined scale end-points of each measurement. The user may manually edit these after the first plot appears, and thus change the scaling of the plot for any and all measurements and the time span. The user must reselect the file to restore the original automatic scales. The user can also exclude any measurement from the plot by clicking its name on this window. Click its name again to return it to the plot. Select OK to replot.
Set this text box blank to select the default standard Windows® text editor NotePad. Since NotePad has file-size limits, it usually “suggests” an automatic switch to the WordPad editor if its limits are reached. 6.1.1.4 PLOTTING LARGE DATA FILES Most typical short data files will plot or print fast enough that you may not notice the processing time. However, Data Scout Advanced is capable of generating data files that are millions of bytes in length.
Notice that this window has two frames of controls: the Original data file specification frame and the New (Converted) data file specification frame. Like all the convert functions, this first function uses the last file selected of DSPlay as a default “root” file name for filling both its file name text boxes. This window allows any original data file, of the two (2) major data types (AutoLog or Record), to be converted into its other format. Here are the conversion possibilities: Live ‘Record’ data (.
6.2.2 CHANGE SELECTED PRESSURE/TEMPERATURE UNITS The second Convert menu selection (Convert | .Txt/.Atd/.Csv Data to Other Units) causes the following new Convert window to open: Figure 4.
Notice that this window has two similar but not identical frames of controls: the Original data file frame and the New (Converted) data file frame. And, like all the other convert functions, this function uses last file selected of DSPlay as default “root” file names for filling its two file name text boxes. The Original file selected (by default, by double-clicking the text box, or by using the Browse button in that frame) may have the .txt or .atd or .csv file extension.
This utility program converts selected uncompensated absolute pressures in an Original input data file, using a reference source of absolute BaroScout pressure data with similar date/time profile. The conversion equations are as follows: pBh = pB * (1 + h * D) (calculates head pressure per baro elevation) p2 = p1 - pBh (subtracts baro head pressure from abs.press.
This tolerance value also applies to Record files if two separate input files are used. For Record files, where the barometer data and pressure samples to be compensated are being scanned together in the same file, the tolerance value is not used. The tolerance can be changed by the user in the special frame shown at the bottom right of the window. The last entry of this tolerance is persistent and is the tolerance used during each subsequent convert session unless change.
compensated pressures that have an unreasonable pressure value, or if the value is replaced with the token “****” or “**nobaro**” then you may choose to view the Details report to find out what went wrong during the conversion. If the report is long, simply search it for any “**” string to find all error messages that indicate a problem. The first section in the header of the Details report contains information on an initial verification phase of the compensation session.
7 . 0 S U P P O RT I N F O R M AT I O N 7.1 WARRANTY The YSI Level Scout Instrument is warranted for two (2) years from date of purchase by the end user against defects in materials and workmanship, exclusive of batteries and any damaged caused by defective batteries. YSI Level Scout cables and suspension wires are warranted for two (2) years from date of purchase by the end user against defects in material and workmanship.
7.2 SPECIFICATIONS These specifications are subject to change without notice. For the most recent specifications please visit www.ysi.com. Level Range: (Vented) 0 - 10 ft, 3.05 m, 4.3352 PSI 0 - 50 ft, 15.24 m, 21.676 PSI 0 - 75 ft, 22.86 m, 32.5140 PSI 0 - 250 ft, 76.2 m, 108.38 PSI 0 - 692 ft, 210.6 m, 299.9956 PSI Range: (Absolute) 0-10 ft. 3.05 m, 19.035 PSI 0-50 ft, 15.24 m, 36.376 PSI 0-70 ft, 21.33 m, 45.046 PSI 0-230 ft, 70.1 m, 114.410 PSI 0-692 ft, 210.9 m, 314.696 PSI Accuracy: 0.
Battery Life 3 years @ 15 minute sample intervals External Excitation 6 – 16 VDC External Input Current 8.0 mA (average current during measurement) 25.0 mA (15 mS peak current during page writes), 0.25 mA (sleep current) Communication Interface RS-485 (3 volt p-p differential with selectable baud rates from 1200 to 19200) Protocol SDI-12 ver 1.3 compliant Weight 0.70 lbs, (318 grams) with batteries 0.15 lbs, (57 grams) cable assembly without cable 0.05 lbs/ft, (79 grams/m) cable 0.
5.3 ACCESSORIES 770 Communication Cable, non submersible. Connects to Level Scout. connectivity. Requires 771(+773) for PC 771 RS-485 to RS-232 converter. Connects to 770, 779, or DB-9 shell style universal field cable, see section2.2.2 for a diagram of all adapters. 772 RS-485 toSDI-12 converter. Connects to 778, 779 or DB-9 shell style universal field cable. 773 RS-232 to USB converter. Connects to 771.
7.4 ORDERING & TECHNICAL SUPPORT YSI has offices located throughout the world. For a listing of office locations along with contact information, please visit www.ysi.com or contact YSI Customer Service at YSI’s global headquarters: Telephone: 800-897-4151 (US) +1 937-767-7241 Monday through Friday, 8:00 AM to 5:00 ET Fax: +1 937-767-9353 (orders) +1 937-767-1058 (technical support) Email: environmental@ysi.com Mail: YSI Incorporated 1725 Brannum Lane Yellow Springs, OH 45387 USA Internet: www.ysi.
APPENDIX A LEVEL SCOUT CONNECTION DIAGRAMS Figure A-1 shows the 778 all-in-one adapter. The 778 provides connection from a field cable with an in-line vent filter to a modem, Pocket PC, or computer. It includes built-in conversion to RS-232C and USB and has a DC input connector for temporary power. Use with a 772 for SDI-12 applications.
Figure A-2 shows the RS-485 communications signal assignments on the 779-0-0 9-pin D-connector that are required for serial communications. Also shown are the signal assignments for the power connector of the 779-0-0. If you need to fabricate your own power connector to mate to this, ensure that the polarities are correct as shown below. The pins outs for the D-connector shown below are the same as those on the discontinued Universal Field cables that terminated in a 9-pin D-connector.
Figure A-3 shows the signal assignment for the RS-232 side of the Model 771 RS-485 to RS232 converter. Model 771 RS-485 to RS-232 Converter Figure A-3 Figure A-4 shows the signal assignments for the Model 772 RS-485 to SDI-12 converter.
Figure A-5 shows the 770 Non submersible Quick Disconnect Communication Cable. It includes an RS-485 communication connector, DC power connector, and battery connector. The 770 is not intended for field deployment. Model 770 Figure A-5 Figure A-6 shows the Suspension Wire Assembly, Model 750 and 760. The Suspension Wire is intended for use with absolute transducers to suspend the unit during deployment.
APPENDIX B SDI-12 COMMUNICATION SDI-12 is an industry standard serial digital interface bus. The bus was designed to allow compatibility between data collection devices of various manufacturers. SDI-12 is a single master multi drop bus and command protocol. As many as 10 sensors can be connected to the bus as a time. Each sensor is pre-assigned a unique address (0-9, a-z, or A-Z). Each Level Scout is factory-set to address 0 (zero).
a (service request response) “2” is number values in “D0” resp: apu or aputu “p” is ± pressure value “u” is + units indicator. Use “XUP” command to set units. If “XUM=1” command is executed then ± temperature value and units code (tu) also appended. attt1 : a (service request response) “1” is number values in “D0” resp: ap “p” is ± pressure value (psi) attt2 : a (service request response) “2” is number values in “D0” resp: atu “t” is signed temperature, “u” is = units: 0-Celsius, 1=Fahrenheit.
APPENDIX C EXECTUTING TEST SCRIPTS This appendix details the formats of Script files and their complementary Log files. These files are read and written, respectively, by the program activated by selecting the Test | Execute Script menu item. This program is hereafter referred to as the Execute Script window or program. Examples of scripts using this program are included at the end.
Please note that the term “base” in transducer base command means that certain special protocol dependent parts of commands should not be included in the script. For example, any SDI-12 command (like the examples above) requires a leading “break” and “mark” period and a trailing exclamation point (!) character be added before command is transmitted to the serial network. However, these items are added by Data Scout Advanced, and should not appear on a script line.
Script program, thus they will not appear in the Log file, which uses its own indenting formats to improve the readability of the executed script results. You must avoid embedding Tab (ASCII 09) characters directly in the text lines of the script. If your text editor adds them, you must disable this behavior or use a text editor that will turn Tabs into spaces.
LOG FILE FORMAT A Log file is a simple text file generated by the Execute Script window when it executes a Script file. It is easily viewed (and edited) with any text editor. As a Script file is executed, line-by-line, each line is also written to the Log file whether it is a transducer base command, a metacommand, comment, or unrecognized. If it is recognized as a transducer base command, it is also transmitted to the transducer.
This meta-command has only one parameter: any text string suitable for prompting the operator. It is also written to the log file, as is any meta-command. The MESSAGE meta-command is used to prompt the operator of the Execute Script while the script is running. The script will pause for exactly five (5) seconds. In such a fixed time period, the operator “may observe” the display prompting message, after which the script file execution resumes on its own.
There is also an SDI-12 protocol-specific form of Wait called WaitSR which also accepts the same delay period argument as Wait. Since it is a conditional wait, it is much more responsive than waiting a fixed amount of time. For example: WaitSR PrvRspSec Wait till transducer returns a Service Request (SR) response indicating that its data is ready. The PrvRspSec argument is used as an ultimate timeout if the expected SR is not received.
transducer or an incorrect command being sent to a transducer. If you can tell, by the display of the commands in the Latest Command status box and the responses in the Latest Response status box that a script has stalled on a command, click the Skip Cmd. button. Such action will force the script to move on to the next command in the file, abandoning its natural wait for the current command’s response (figure C-1). This Skip Cmd. button will also cancel any long delays (e.g.
The script file above shows nested looping capabilities. The outer loop (#1) has its repeat count (2) specified at the top of the loop. The inner loop (#2) has its repeat count (4) specified at the bottom of the loop. Please note that the XM+1 command requires an extra step (reading of Service Request with a simple “address only” command). This is because this particular command is an “old” command that requires this extra step.
Rsp<0024>: Wait began at 09:11:05 and ended at 09:11:07 Cmd<0025>: (#1)D0 Expanded adrs.macro cmd: 0D0 Rsp<0025>: _0D0!0+12.4 Cmd<0026>: LOOP1 Repeat Loop1 Cmd<0027>: DO LOOP1 2 Begin Loop1 (2 in 2 times) Cmd<0028>: DO LOOP2 Begin Loop2 Cmd<0029>: (#1)I Expanded adrs.macro cmd: 0I Rsp<0029>: _0I!013-YSI---VS2---1.0-SN# Cmd<0030>: LOOP2 4 Repeat Loop2 (1 of 4 times) Cmd<0031>: DO LOOP2 Begin Loop2 Cmd<0032>: (#1)I Expanded adrs.macro cmd: 0I Rsp<0032>: _0I!013-YSI---VS2---1.
#605815 Rev E August 2010 Data Scout Advanced Manual YSI Incorporated YSI Incorporated Data Scout Advanced 111