
Manual


YSI 5X00
185
YSI 5X00
184
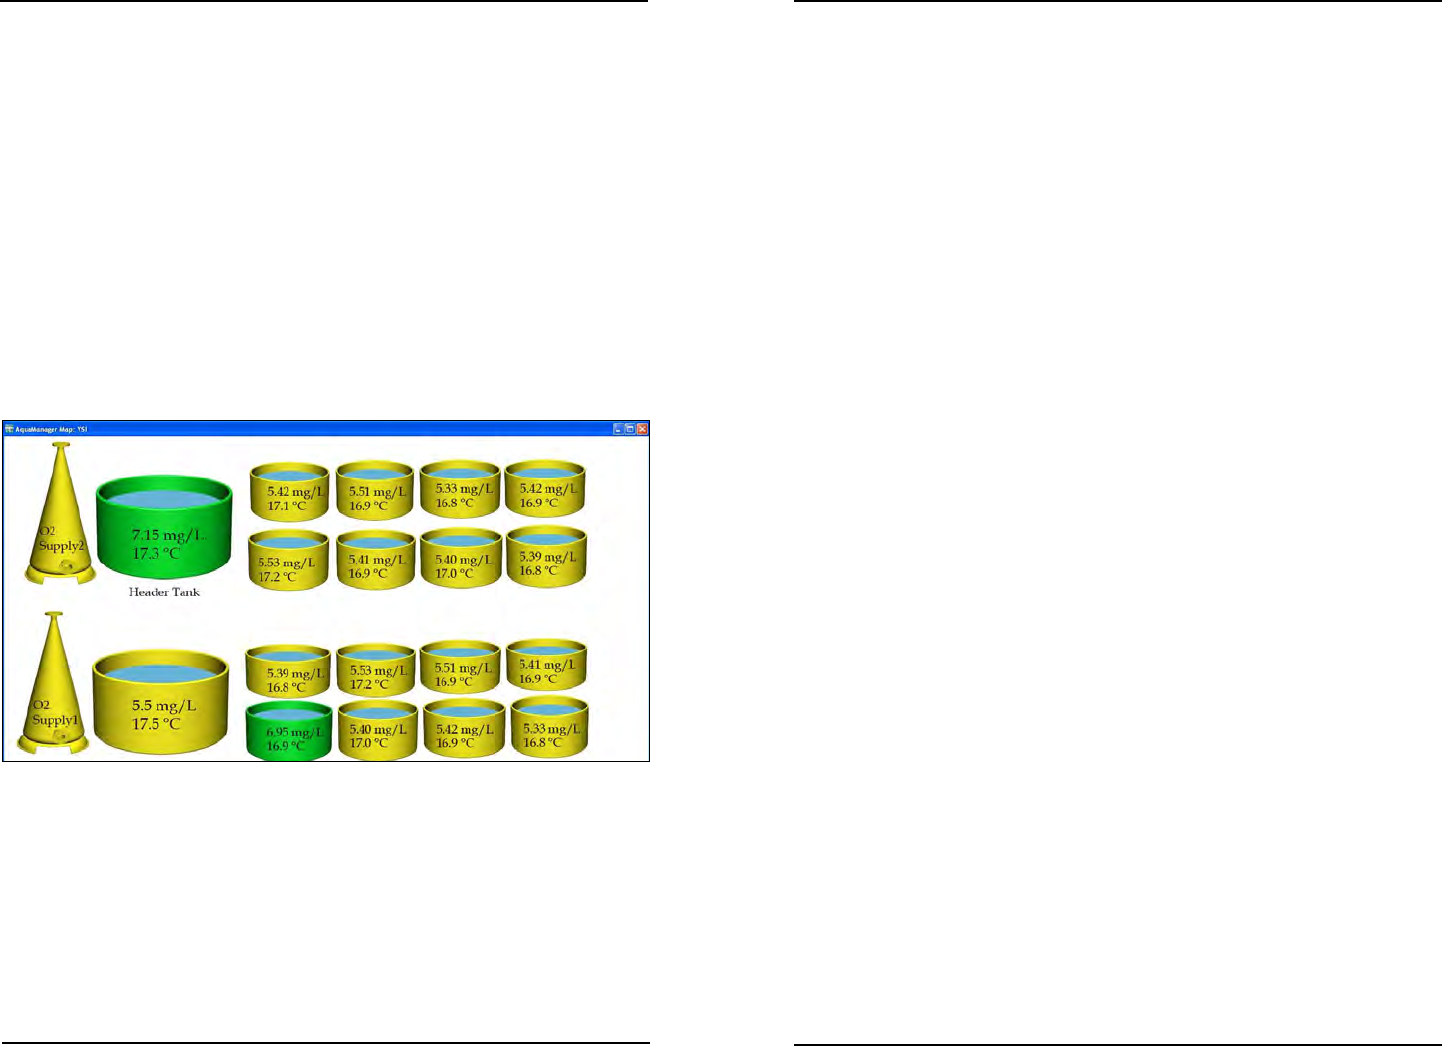
Mapping
Create a network map to display current conditions* for 5X00 nodes at PC run-
ning AquaManager. Map icons are congured to represent nodes, node systems,
and relays. Map icon images change based on system condition(s). For example, a
green icon is displayed when DO-1 is in acceptable operating range, a yellow icon
is displayed when DO-1 system is in control range (when enabled), and a red icon
is displayed when DO-1 system is in alarm range. is provides a quick visual of
system conditions at the PC.
*Near real-time - Map is updated several times a minute as AquaManager constantly
communicates with nodes during Autopolling.
Node mapping is available for direct and TCP/IP node communication types.
e following gure is an example of an AquaManager map.
AquaManager Alarm Emails
e PC running AquaManager can be congured to send an alarm email when data
received from the node is in alarm range. e alarm range or condition is based on
the node conguration. e node conguration is stored in the network database and
is veried and updated at each Autopoll SMS communication interval. Autopoller
must be running for AquaManager to generate alarm emails. Run Autopoller 24/7
to ensure that alarm emails are sent.
AquaManager
For the AquaManager alarm email to function properly, it may be necessary to send
a test email to each email address congured in the Email Alarm List in the Node
Properties window. Test emails can be sent in the AquaManager Properties window
under the Autopoller tab.
AquaManager