Operation Guide Yokogawa Electric Corporation MW100 Data Acquisition Unit IM MW100-02E 4th Edition
User Registration Thank you for purchasing YOKOGAWA products. We invite you to register your products in order to receive the most up to date product information. To register, visit the following URL, or click the “Product Registration” button in the opening screen of the Manual CD-ROM. http://www.yokogawa.
Contents Checking the Contents of the Package........................................................................................................................5 Introduction to Functions............................................................................................................................................10 Overview of the MW100 Data Acquisition Unit ........................................................................................................
Thank you for purchasing the MW100 Data Acquisition Unit. This manual provides an overview of the operating procedures of the MW100 Data Acquisition Unit, and the basic operating procedures of the Viewer software. To ensure correct use, please read this manual thoroughly before beginning operation. The following manuals relating to the MW100 Data Acquisition Unit are provided in addition to this one. Read them along with this manual.
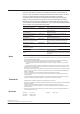
Checking the Contents of the Package Unpack the box and check the contents before operating the instrument. If some of the contents are not correct, or if any items are missing or damaged, contact the dealer from whom you purchased them. Checking the Model and Suffix Code Check the model and suffix code on the name plate indicated in the figure below. Main module MODEL SUFFIX MAC NO. MODEL SUFFIX MAC NO.
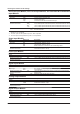
Checking the Contents of the Package Universal Input Module, DCV/TC/DI Input Module, and Four-Wire RTD Resistance Input Module Model MX110 Input type Suffix Code Description -UNV -VTD -V4R For DCV/TC/DI/3-wire RTD input For DCV/TC/DI input For DCV/DI/4-wire RTD/4-wire resistance input Number of channels and -H04*1 4-CH, high-speed measurement (minimum measurement Interval: 10 ms) measurement interval -M06*1 6-CH, medium-speed measurement (minimum measurement interval: 100 ms) -M10*1 10-CH, medium-speed
Checking the Contents of the Package Base Plate Model MX150 Base type Suffix Code Description Includes two brackets for DIN rail mount -1 to -6* The value of the suffix code corresponds to the maximum number of input output modules that can be installed. MX150-6 is for one main module, and six input/output modules. * One unit of the MX110-VTD-L30 requires three modules worth of space when installing. Standard Accessories The following standard accessories are supplied with the main module.
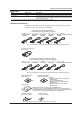
Checking the Contents of the Package Optional Accessories (Sold Separately) AC adapter No. Name Model Basic Suffix Code Min. Q’ty Note 1 772075 -D -F -R -Q -H 1 1 1 1 1 No. Name 2 10-CH screw terminal block (with RJC) Model 772061 3 Connection cable between the input module and screw terminal block Connection cable between the input module and screw terminal block Plate with clamp terminals (with RJC) 772062-050 Min.
Checking the Contents of the Package 2 3, 4 5 6 7 8 9 10 11 Shunt resistor No. Name 16 Shunt resistor (for the clamp terminal) 17 Shunt resistor (for the clamp terminal) 18 Shunt resistor 19 Shunt resistor 20 Shunt resistor 21 Shunt resistor 12 Min. Q’ty Note 1 Resistance: 250 Ω±0.1% 438921 1 Resistance: 100 Ω±0.1% 438922 415920 415921 415922 1 1 1 1 Resistance: 10 Ω±0.1% Resistance: 250 Ω±0.1% Resistance: 100 Ω±0.1% Resistance: 10 Ω±0.1% No.
Introduction to Functions For details on individual functions, see one of the following user’s manuals located on the enclosed CD-ROM: MW100 Data Acquisition Unit User’s Manual (IM MW10001E, MW100 Communication Command Manual (IM MW100-17E), or MW100 Viewer Software User’s Manual (IM MW180-01E).
Introduction to Functions Overview of MW100 Viewer Software MW100 Viewer Software consists of the three software components described below.
Introduction to Functions Viewer You can load the measured/computed data that was saved in the past and carry out the operations below. You can also display manual sample files and report files. • Joining When opening a divided data file, related files can be joined and displayed.
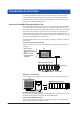
Introduction to Functions Flow of Operations during Installation The figure below shows the general flow of operation when the MX100 is installed initially. Operations on the MW100 Install the MW100 Wire the input/output modules Connect the network cable Connect the power cable Turn ON the power switch Operations on the PC See the Installation and Connection Guide*. See the Installation and Connection Guide*. Page 14 See the Installation and Connection Guide*.
Connecting to a Network Connecting an Ethernet Cable to the Main Module Connect the Ethernet cable to the Ethernet port on the main module. Use a UTP (category 5 or higher) or STP Ethernet cable. Ethernet port RJ-45 modular jack Ethernet cable Checking the Communication Status You can check the status on the two LEDs at the upper-right and lower-right of the Ethernet port.
Connecting the Main Module to a PC Ethernet Connection Setting the IP Address Because the IP address is not set by factory default, set the IP address first. 1. After opening an Ethernet connection between the MW100 and PC, run the MW100 Viewer Software CD-ROM or the IP address setting software installed on the PC. 2. Click here. The MW100 information is displayed. 3. Click here. Information appears in the address setting screen. 4. Click here. Setting changes are enabled.
Connecting the Main Module to a PC 5. Make entries in the address setting screen. The following is an example of editing such entries. mw100user Host name: Specify IP address: 192.168.1.100 Subnet mask: 255.255.255.0 Default gateway: 192.168.1.1 Specify a DNS server Primary DNS server: 192.168.1.101 Secondary DNS server: 192.168.1.102 Specify a domain suffix Primary domain suffix: daqmaster1.com Secondary domain suffix: daqmaster2.
Entering Settings on the MW100 Using a Browser MW100 System Settings Display of Module Information and Reconfiguration 1. From the browser top screen, click System Setting > Module Information. The module information screen is displayed. 2. If the Configured Module and Attached Module displays are different, click here. System reconfiguration is executed. The Configured Module and Attached Module displays become the same.
Entering Settings on the MW100 Using a Browser Checking Free Space on the CF Card and Initializing 6. After choosing System Setting in step 5, click System Information. The amount of free space on the CF card is shown under Media Information. 7. To initialize the CF card, click here, then click the Initialize button. Measurement Groups and Measurement Module Settings 1. From the browser top screen, click System Setting > Measurement Setting. The measurement operation setting screen in displayed.
Entering Settings on the MW100 Using a Browser Settings for Recording to CF Card 1. From the browser top screen, click System Setting > Recording Setting. The recording operation setting screen in displayed. 2. Click here, then select the save start operation. 3. Click here to select the type of recording. 4. Click to select the recording interval. Set an integer multiple of the measurement interval. 6. Select a trigger length if data is to be saved upon activation of the trigger.
Entering Settings on the MW100 Using a Browser Measuring Interval and Range Settings (for the Universal Input Module) 1. From the browser top screen, click Channel Setting > AI/DI Channel Setting. The input range setting screen appears. 2. Click the list, then select the channel range you wish to set. 3. Set the input type, measuring range, measurement span, scale, and other items. The following is an example.
Entering Settings on the MW100 Using a Browser Alarm and Relay Settings 1. From the browser top screen, click Channel Setting > Alarm Setting (AI/DI). The alarm setting screen in displayed. 2. Select the channel range you wish to set in the list. 3. Select the alarm type, then enter the alarm value and hysteresis. For details on alarm setting items, see the MW100 Data Acquisition Unit User’s Manual (IM MW100-01E), section 1.3. 4. Click here. The alarm settings are changed. 5.
Changing Monitor Screen Display Conditions Stop measurement, then change the display method. After changing the display method, start measurement and display the monitor screen. The screen is updated according to the new settings. For details on display settings, see the MW100 Data Acquisition Unit User’s Manual (IM MW100-01E), section 3.15. Tag Settings 1. From the browser top screen, choose Display Setting > Channel Tag Setting. The tag setting screen in displayed. 2.
Changing Monitor Screen Display Conditions Display Scale Settings 1. From the browser top screen, choose Display Settings > Graph Scale Setting. The scale setting screen in displayed. 2. Click to select the channel range you wish to set. 3. Select each setting item, or specify it. The graph display reference position is applied to the numerical and bar graph displays. Other settings are applied to all types of display screens. 4. Click here. The display settings are changed.
Changing Monitor Screen Display Conditions Display Color Settings 1. From the browser top screen, choose Display Setting > Channel Color Setting. The color setting screen in displayed. 2. Click to select the channel range you wish to set from the list. 3. Refer to the display colors below, then specify a channel color. The color changes to the one specified. 4. Click here. The color settings are changed. Display Group Settings 1.
Starting and Stopping Measurement and Recording To start and stop measurement and recording, you can use the keys on the MW100 Main Module, or use the browser.
Starting and Stopping Measurement and Recording Starting Recording 1. Check whether the instrument is measuring by looking at the MW100 main module’s status indicator, or in the browser’s top screen. 2. Press the MW100 main module’s START key for about two seconds, or select Start in the Operation list under Recording in the browser top screen’s Status table. Measured data is saved to the CF card. File menus are automatically generated using the date and serial number. MDDIXXXX.
Viewing Measured Data on the Monitor Screen and Starting/Stopping Recording In the browser monitor screen, you can view data being measured in a trend, numerical, meter, or bar graph display. You can also start and stop recording, pause the monitor display, write messages, and perform other functions. 1. Check whether the instrument is measuring by looking at the MW100 main module’s status indicator, or in the browser’s top screen. 2. From the browser top screen, click Single Screen or Dual Screen.
Viewing Measured Data on the Monitor Screen and Starting/Stopping Recording Dual Screen (Trend Display) Use this when the monitor screen contains two screens. You can display two groups. From the top screen, click Dual Screens. The contents of the status bar are as follows: MW100 serial number MW100 firmware version Measurement group recording operation (1 to 3)/ thinning recording operation (T)/ report recording operation (R) status.
Viewing Measured Data on the Monitor Screen and Starting/Stopping Recording • Digital Display Displays measured values as numerical values. When alarms are set, the alarm status is displayed to the left of the numerical value.
Viewing Measured Data on the Monitor Screen and Starting/Stopping Recording • Overview Display Alarms (status and type) and measured values are displayed as numerical values in the monitor display screen. Skipped channels are not displayed. If the size of the window is reduced, only the alarms are displayed. Starting Recording 4. Click the Record Start button in the screen display. Saving of data to the CF card begins. Click to start recording. Stopping Recording 5.
Viewing Measured Data on the Viewer Software Displaying Data You can view data files saved to the CF card and data files that have been transferred to the PC from the FTP server using the Viewer. 1. Choose Programs > MW100 Viewer > MW100 Viewer to start the Viewer. 2. Click the button on the toolbar or choose Open from the File menu. The Open dialog box opens. File information 3. Select the file you wish to load and click the Open button. The waveform display window opens.
Viewing Measured Data on the Viewer Software Changing the Display on the Waveform Display Window Change the display settings according to the explanation in the figure below.
Viewing Measured Data on the Viewer Software Changing the Display Using the Display Setup Window See the explanation in the figure below. Change the display settings and click OK. Set the display for each display group.
Viewing Measured Data on the Viewer Software Reading Values Using the Cursor Group selection tab Measurement point Cursor A Cursor B 2. Click the mouse where you wish to read the data in the waveform display window. If you wish to read another point simultaneously, drag the cursor. Cursor A appears at the position where you first clicked; Cursor B appears at the position where you released the mouse button. Time at Cursor B 3. From the Window menu, choose Cursor value display.
Viewing Measured Data on the Viewer Software 4. From the Window menu, choose Statistics. The Statistics window opens.
Viewing Measured Data on the Viewer Software Setting the Contents to Be Printed 1. From the File menu, choose Print Settings. The Print Settings dialog box in the figure below opens. 2. Edit the print settings.