
Instruction Manual


IM 11M12A01-03E
10-5
10. Other Functions
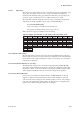
10.1.2 Trend Graph
Press the Graph display key in the basic panel display to switch to the graph display.
This will help grasp the measured-value trend. Touching anywhere on the graph display
will return to the basic panel display. To set the trend graph display, follow the steps in
Section 10.1.2.1.
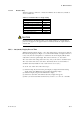
10.1.2.1 Setting Display Items
(1) Press the Setup key in the Basic panel display to display the Execution/Setup display.
Select Maintenance from the Execution/Setup display.
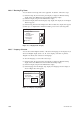
(2) Select Display setup from the Maintenance display.
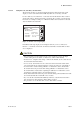
(3) Select Trend graph from the Display setup display. The Trend graph display shown
in Figure 10.4 appears.
Select “Parameter: Oxygen” from the Trend graph display. Then select the desired
display item shown in Table 10.2.
Table 10.2 Trend Graph Display Items
Selected item Description
Oxygen concentration Oxygen concentration graph under measurement
Humidity Humidity graph under measurement
Mixing ratio Mixing-ratio graph under measurement
Output 1 Output 1-selected item graph
Output 2 Output 2-selected item graph
T10.2E.EPS
Enter
Parameter:
Oxygen
r Sample interval: 3 0 s
Scale Oxygen
r Upper limit: 2 5 . 0 % O2
r Lower limit: 0 . 0 % O2
Trend graph
F10.4E.EPS
Figure 10.4 Trend Graph