
User guide

12-3
IM 04L41B01-01E
Specifications
1
2
3
4
5
6
7
8
9
10
11
12
App
Index
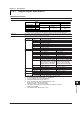
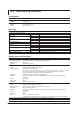
12.2 Display Function
Display
Item Specifications
Display* 5.5-inch TFT color LCD (240 × 320 dots)
Brightness 8 levels
Backlight saver function Dim or turn off the LCD backlight if there is no key operation for a specified time.
* A section of the LCD monitor may contain pixels that are always on or off. The brightness of the LCD may also not be uniform
due to the characteristics of the LCD. This is not a malfunction.
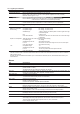
Displayed Information
Item Specifications
Display groups Assign channels to groups on the trend display, digital display, and bar graph display and display.
Number of groups 10
Number of channels that can be assigned to each group
Up to six
Display color Channel: Select from 24 colors
Background: Select white or black (excludes the Overview, Alarm annunciator, and Custom
displays. See the item on the Historical trend display for information on that display.)
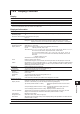
Trend display
Waveform line width Select from 1, 2, and 3 dots
Display method Orthogonal axis display with time axis (T) and measured value axis (Y)
Layout: Vertical, horizontal, wide, or split
Trend intervals: 5 s
*
, 10 s
*
, 15 s, 30 s, 1 min, 2 min, 5 min, 10 min, 15 min, 20 min, 30 min, 1 h, 2 h, 4 h,
and 10 h/div for the DX1002, DX1002N, DX1004, and DX1004N.
15 s (only in fast sampling mode
*
), 30 s, 1 min, 2 min, 5 min, 10 min, 15 min, 20
min, 30 min, 1 h, 2 h, 4 h, and 10 h/div for the DX1006, DX1006N, DX1012, and
DX1012N.
* release number 3 or later
Switchable to the secondary trend interval.
Scale Display a scale for each channel.
Current value bar graph, color scale band, and alarm point marks can be displayed on the scale.
Others Grid (divisions: 4 to 12), trip line (line width: 1, 2, or 3 dots), message, zone display, partial expanded
display, auto zone display (release number 3 or later), fine grid (release number 3 or later), and tag
detail display (release number 3 or later)
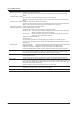
Digital Display Displays measured values numerically
Update rate 1 s (scan interval if the scan interval is greater than 1 s)
Bar graph display Displays the measured value on a bar graph
Direction
Vertical or horizontal
Base position End or center
Update rate 1 s (scan interval if the scan interval is greater than 1 s)
Scale Display a scale for each channel
Color scale band, and alarm point marks can be displayed on the scale.
Historical trend display
Redisplays the display data or event data in the internal memory or external storage medium.
Display formats All screen or half screen (only when the display data is being redisplayed)
T
op channel (release number 3 or later): Displays the specified channel in front of all the
others.
Auto span display (release number 3 or later): Automatically adjusts the display span of the
specified channel.
Auto zone display (release number 3 or later): Displays channels in dif
ferent zones.
Time axis operation The time axis can be reduced or expanded, and data can be displayed continuously. The time
display can be switched from absolute to relative time (release number 3 or later).
Add message Messages can be added.
Background color Select from white, cream, black, or light gray.
Data search
Waveforms from the internal memory can be displayed through the specification of a date and time
(release number 3 or later).
Overview Display Displays the measured values of all channels and the alarm statuses.