
User guide


Switching Operation Screens
4-41
IM 04L41B01-01E
1
2
3
4
5
6
7
8
9
10
11
12
App
Index
Explanation
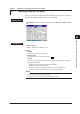
• SINGLE GRAPH/DUAL GRAPH
You can display one or two bar graphs. The sums of the rst channel in a group and of
all other channels that have the same unit as it are displayed.
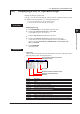
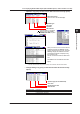
• SINGLE GRAPH
Numeric display section
Display area 1
Display area 2
The displayed report data varies depending on the report kind, which is set using
the report function.
Report kind Display Area 1 Display Area 2
Hour, H+D Sums for each hour Sums for the day
Day+Week Sums for each day Sums for the week
Day, D+M Sums for each day Sums for the month
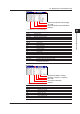
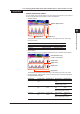
• DUAL GRAPH
Shows the data from two consecutive periods at the top and bottom of the display.
Channel number or tag
Numbers are abbreviated.
Display area 1
Display area 2
Display area 4
Display area 3
The displayed report data varies depending on the report kind, which is set using
the report function. Display areas 1 and 2 contain the same report data listed above
for SINGLE GRAPH display.
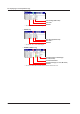
Report kind Display Area 1 Display Area 2 Display Area 3 Display Area 4
Hour, H+D Sums for each
hour
Sums for the day Sums for each
hour
Sums for the day
(The data of the day before the data
in display areas 1 and 2)
Day+Week Sums for each
day
Sums for the
week
Sums for each
day
Sums for the
week
(The data of the week before the
data in display areas 1 and 2)
Day, D+M Sums for each
day
Sums for the
month
Sums for each
day
Sums for the
month
(The data of the month before the
data in display areas 1 and 2)
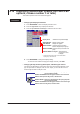
4.10 Displaying Stacked Bar Graphs (/M1 and /PM1 options; release number 3 or later)