User’s Manual MW100 Viewer Software IM MW180-01E 4th Edition
Thank you for purchasing the MW100 Data Acquisition Unit. This user’s manual contains useful information about the functions and operating procedures of the MW100 Viewer Software and lists the handling precautions of the software. To ensure correct use, please read this manual thoroughly before beginning operation. After reading the manual, keep it in a convenient location for quick reference whenever a question arises during operation.
Trademarks • DAQMASTER is a registered trademarks of Yokogawa Electric Corporation. • Microsoft and Windows are registered trademarks or trademarks of Microsoft Corporation in the United States and/or other countries. • Adobe and Acrobat are registered trademarks or trademarks of Adobe Systems Incorporated. • Company and product names that appear in this manual are registered trademarks or trademarks of their respective holders.
Terms and Conditions of the Software License NOTICE - PLEASE READ CAREFULLY BEFORE USE Thank you very much for purchasing this medium containing a software program and related documentation provided by Yokogawa Electric Corporation (hereinafter called “Yokogawa”), and the program contained, embedded, inserted or used in the medium (hereinafter called the “Yokogawa Software Program”).
Terms and Conditions of the Software License 4.4 Notwithstanding the preceding Paragraph 4.3, in no event shall Yokogawa provide Updates where the Licensee or any third party conducted renovation or improvement of the Licensed Software. 4.
Contents 1 Terms and Conditions of the Software License............................................................................. iii Chapter 1 Chapter 2 Chapter 3 Chapter 4 Chapter 5 Appendix Before Using the Software 1.1 1.2 1.3 Functional Explanation of MW100 Viewer Software....................................................... 1-1 System Requirements.....................................................................................................
Chapter 1 Before Using the Software 1.1 Functional Explanation of MW100 Viewer Software 1 Before Using the Software MW100 Viewer Software consists of the following three software components.
1.1 Functional Explanation of MW100 Viewer Software Viewer You can load data generated by the MW100 and apply the following processes to those various data. Measured, Computed, and Thinned Data (with the .MXD Extension) • Joining When opening a divided data file, related files can be joined and displayed.
1.1 Functional Explanation of MW100 Viewer Software 1 Manual Sample Data (with the .DAM extension) Before Using the Software 2 3 • File information display (display when opening files) • Date/time numeric display • Data printing (date/time, numerical value, serial number, unit number) 4 Report Data (with the .
1.2 System Requirements Operating System (OS) Run the system under any of the following operating systems.
1.3 Setup Procedures of the MW100 Viewer Software 1 Before Using the Software The following procedures are for installing the software on Windows XP. 2 1. Start Windows. Log onto Windows as an administrator (Otherwise, you will not be able to install the software). This is the same when using an OS other than Windows XP. 3 When Auto Run Is Enabled 2. Insert the CD-ROM in the CD-ROM drive. The setup program automatically starts. Proceed to step 4. 4 When Auto Run Is Disabled 2.
1.3 Setup Procedures of the MW100 Viewer Software 6. In the next dialog box, enter the user name, company name, and license number, and click Next. The license number is written on the label that is attached to the front of the case for the MW100 Viewer Software Setup CD-ROM. 7. Select the setup type to install, and click Next. The default destination to install is [C:\Program Files\Yokogawa Electric Corporation\MW100 Viewer Software].
1.3 Setup Procedures of the MW100 Viewer Software 1 Explanation If the software is properly installed, a folder named MW100 Viewer Software is created in the specified directory (the C: /Program files/Yokogawa Electric Corporation by default). MW100 Viewer Software is registered in the program list, and MW100 IP Configurator, MW100 Viewer, and MW100 Calibrator are registered as in the sub list.
Chapter 2 Address Setting Software 2.1 Names of Parts in the Address Setting Software Screen and Their Uses 1 Parts of the Address Setting Software Screen 2 Address Setting Software Menu bar 3 4 5 Status bar App Address setting screen List display screen Shutter for expanding/reducing the size of the list display screen Index Names of Parts of the List Display Screen and Their Uses You can click the List Display Screen shutter to expand the display as in the figure below.
2.1 Names of Parts in the Address Setting Software Screen and Their Uses Address Setting Screen If the check box is selected, the items that can and cannot be set change. Dimmed setting items cannot be changed. Click the Network Settings button to enable changes to settings. Restored to the condition before editing. Resolves the IP address from the DHCP server. Restores the settings to their defaults. At the same time that the defaults are restored, the software searches again for MW100s.
2.2 Setting Item Details 1 Procedure Opening a Local (1-to-1) Connection between the PC and MW100 and Changing the Address The MW100 cannot perform communication using the factory default IP address. Create a local (1-to-1) connection between the MW100 and the PC on which the Address Setting software is installed, or the PC on which the Address Setting software CD-ROM has been inserted, and change the IP address. The procedure for changing the address is as follows.
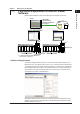
2.2 Setting Item Details Changing the MW100 Fixed IP Address Setting 1. Turn OFF the power to the MW100, turn dip switch number 8 (only) OFF, then turn the power back ON. The MW100’s IP address and subnet mask are set to 192.168.0.10 and 255.255.255.0, respectively. 2. Set the PC’s network settings to 192.168.0.xx, and the subnet mask to 255.255.255.0. (where xx is a number other than 10 from 1 to 254). 3. Type 192.168.0.10 in the browser to connect to the MW100.
2.2 Setting Item Details IP Address Setup Example of the PC and MW100 IP address of the PC Subnet mask of the PC IP address of the MW100 Subnet mask of the MW100 192.168.0.100 255.255.255.0 192.168.0.10 255.255.255.0 2 3 4 5 Note To initialize all settings including the IP address to the their factory default values, turn OFF the power to the main module, turn OFF dipswitch number 5 on the main module, and then turn ON the power. When the 7-segment LED displays bF, all settings are initialized.
2.2 Setting Item Details Primary DNS Server Secondary DNS Server The DNS is a system that pairs domain names with IP addresses. Host names and IP addresses must be registered on the DNS server that handles the domain names in order to access other instruments on the network by host name and domain name. Also, on the MW100, the domain name is also used as a domain suffix. On the MW100, you can specify two DNS servers. You must enter IP addresses. Consult your network administrator for details.
Chapter 3 3.1 Viewer Loading Measured, Computed, and Thinned Data 1 Procedure 2 1. Start the Viewer. 2. From the File menu, choose Open. button on the toolbar. 3 3. Select the file you wish to load and click Open. Viewer You can also click the The Open dialog box opens. The waveform display window opens.
3.1 Loading Measured, Computed, and Thinned Data Explanation Loadable Files • Files transferred via FTP on the MW100 (.mxd extension). • Data files are saved to the CF card using the MW100 (.mxd extension). • Files saved after being joined and saved on the software (with the .mxc extension).
3.1 Loading Measured, Computed, and Thinned Data 1 2 3 Viewer • Data are joined by file groups of data with multiple measurement groups of the same file number • If a number of files equaling the number of measurement groups of the specified file number (if three measurement groups are specified, the number would be 3) does not exist in the file group, files just prior to the file group of the relevant file number are joined. • The resulting files that are created are limited to five million points/2 GB.
3.2 Settings Related to Displaying Measured, Computed, and Thinned Data Procedure Changing the Display on the Waveform Display Window Change the display settings according to the explanation is the figure below.
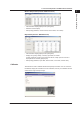
3.2 Settings Related to Displaying Measured, Computed, and Thinned Data 1 Changing the Display Using the Menu Choose appropriate commands from the Edit, View, and Window menus to change the display. Show the computation result display window 2 Switch between absolute and relative time*2 3 Change the data file display Switch between channel number, tag name, and tag comment*1 Clear the Cursor Add/delete a mark Arrange the display window *1 MW100 data do not have tag comments associated with them.
3.2 Settings Related to Displaying Measured, Computed, and Thinned Data Explanation Display Groups and Group Names The values of each channel that are loaded are divided into groups that were used during recording and displayed using waveforms or numeric values. The measured/computed values can be divided into up to fifty groups. Up to thirty-two channels can be registered to a single group. If you click the channel selection button on the General Display Settings window, the Channel No.
3.2 Settings Related to Displaying Measured, Computed, and Thinned Data Maximum and Minimum Values of the Y-Axis and the Display Format of the Y-Axis Values The maximum and minimum values of the scale on the waveform display can be changed. If you click the Scale Calc. button on the General Display Settings window, the maximum and minimum values of the Y-axes on the selected channels are calculated automatically according to the maximum and minimum values of the data.
3.2 Settings Related to Displaying Measured, Computed, and Thinned Data • Full zone Displays all the waveforms over the full zone of the waveform display area regardless of the Zone settings on the General Display Settings window. A single Y-axis scale of the active channel can be displayed.
3.2 Settings Related to Displaying Measured, Computed, and Thinned Data • Multi-axes zone All the specified Y-axis of the displayed waveforms are aligned horizontally. To hide a Y-axis, clear the Y-axes check box on the General Display Settings window. The display position is set using Zone on the General Display Settings window. Dragging the channel bar to the waveform display area shows the Y-axis of the corresponding channel.
3.2 Settings Related to Displaying Measured, Computed, and Thinned Data Channel Color Clicking the channel color displayed in the Color column on the Display setup screen opens the Color dialog box. You can select the color of each channel using the Color dialog box. Clipping of Waveforms By default (clip OFF), the waveform is not displayed when the measured/computed value exceeds the minimum/maximum value of the scale (see the lower left figure).
3.2 Settings Related to Displaying Measured, Computed, and Thinned Data Adding Marks Mark display icon Display/hide time at marks Display the cursor Left: Time displayed Flag Right: Time hidden 1 2 3 Viewer In addition to the marks placed during measurement on the MW100 using other programs such as the browser, you can add marks at the positions where you click (displays a cursor) on the waveform display area.
3.2 Settings Related to Displaying Measured, Computed, and Thinned Data Showing/Hiding Alarms You can hide the alarm display area that indicates the status of alarm occurrence. The alarms are displayed in the same fashion as the alarms displayed in the waveform display area of the Integration Monitor. Show/Hide the alarms No alarm display Alarm display area Alarm/Mark List Display Displays a detailed list of alarms and marks. From the Window menu, choose Alarm/Mark List.
3.2 Settings Related to Displaying Measured, Computed, and Thinned Data The alarm/mark list display’s cursors are linked with those of the waveform display and numeric display layout screens. Alarms or marks selected with the cursor in the alarm/ mark list display can be copied to the clipboard using the Edit > Copy command. The alarm/mark list can be converted to ASCII, Excel, or Lotus format (see section 3.7). Alarm display limitation: One file can display a maximum of 10000 alarms.
3.2 Settings Related to Displaying Measured, Computed, and Thinned Data Numeric Display Numeric display can be shown along with the waveform display window. When a group contain channels with different measurement intervals, the screen is divided accordingly. The display group, active channel, and mark display are synchronized to the waveform display. If cursors are displayed on the numerical display window, the data values between the cursors are displayed in red.
3.2 Settings Related to Displaying Measured, Computed, and Thinned Data 1 Initializing, Copying, and Pasting of Settings on the General Display Settings Window On the General Display Settings window, you can reset the settings to default or copy and pate the settings of one or multiple waveforms to the settings of other waveforms. You can copy and paste according to the procedure below. Drag the copy source waveform numbers (No.
3.3 Reading Measured, Computed, and Thinned Values Using the Cursors Procedure 1. On the waveform display window, click the tag of the group from which you wish to read the value using cursors. 2. Click the position of the desired data in the waveform display area of the waveform display window. If you wish to read another point simultaneously, drag the cursor. Cursor A appears at the position where you first clicked; Cursor B appears at the position where you released the mouse button.
3.3 Reading Measured, Computed, and Thinned Values Using the Cursors 1 Clearing the Cursor From the Edit menu, choose Erase Cursor. The cursors are cleared as well as the cursor values displayed in the Cursor Value dialog box. 2 Explanation Reading Measured/Computed Values Using Cursors Note • • • • • IM MW180-01E The cursors used to display cursor values and those used to specify the interval for statistical computation over an area are the same.
3.4 Statistical Computation over an Area of Measured/Computed Data Procedure 1. On the waveform display window, click the tab of the group on which you wish to perform statistical computation over an area. 2. Click the start position of the computation area in the waveform display area. A light-blue cursor appears in the waveform display area. If multiple waveform display areas are displayed, the cursor is displayed at the time position each waveform display area. 3.
3.4 Statistical Computation over an Area of Measured/Computed Data 1 Explanation Statistical Computation over an Area Specify using two cursors the interval over which computation is to be performed. If the cursors are not displayed, all the data are used in the statistical computation. The statistical parameters are the minimum value, the maximum value, the P-P value (maximum - minimum), the average value, and the rms value.
3.5 Saving Display Settings for Measured, Computed, and Thinned Data Procedure From the File menu, choose Save Display Setting File. You can also click the button on the toolbar. The display setting file is created in the same folder as the data files. When Closing the Viewer If you open a file and change the display settings, the dialog box below opens when you attempt to close the Viewer. To save the changed display settings, click Yes.
3.6 Saving the Display Template for Measured, Computed, and Thinned Data 1 Procedure 2 Saving Templates 1. From the File menu, choose Save Template. 3 Viewer The currently displayed settings are saved as a template file to the same folder as the displayed data. 4 Using Templates 5 1. From the File menu, choose Use Template.
3.7 Converting the Data Formats for Measured, Computed, and Thinned Data Procedure 1. From the Convert menu, choose To ASCII, To Excel, or To Lotus. 2. After entering various settings in the dialog box that opens, click OK. The file is created at the specified destination.
3.7 Converting the Data Formats for Measured, Computed, and Thinned Data Converted Data Specify the range using group numbers or channel numbers. You can select the channel number by clicking in the dialog box as shown below. 1 2 Conversion Range and Step You can specify the range using data numbers or by using cursors. For the method of specifying the range using cursors, see the procedure in section 3.4, “Statistical Computation over an Area of Measured/Computed Data.
3.8 Loading Manual Sample Files Procedure 1. Start the Viewer. 2. From the File menu, click Open. You can also click the button on the toolbar. The Open dialog box is displayed. 3. Select the manual sample file you wish to load and click Open. The manual sample file window is displayed. File information The manual sample file window opens, as in the figure below.
3.9 Loading Report Files 1 Procedure 2 1. Start the Viewer. 2. From the File menu, click Open. button on the toolbar. You can also click the 3 The Open dialog box is displayed. Viewer 3. Select the report file you wish to load and click Open. The report file window is displayed. 4 5 App Index File information The report file window opens as in the figure below.
3.10 Printing the Data You can print files loaded onto MW100 Viewer. The contents that can be printed differ depending on the file type. • Measured, computed, and thinned data files The contents described in this section can be printed. • Manual sample data and report data files You can print, confirm the contents to be printed, and enter printer settings. Procedure Setting the Contents to Be Printed 1. From the File menu, choose Print Settings. 2.
3.10 Printing the Data 1 Executing the Print Operation 1. From the File menu, choose Print. The Print dialog box opens. 2. In the Print dialog box, select the printer, print range, and the number of copies, and then click OK. 2 When printing waveforms, you cannot set the print range. Display example of the Print dialog box 3 Viewer 4 5 Print Preview From the File menu, choose Preview. App The print image is displayed. Index Setting Up the Printer 1.
3.10 Printing the Data Explanation Printed Items To print waveforms, open the waveform display window; to print numeric values, open the numeric display window; to print alarm or mark lists, open the alarm/mark list display window. If multiple waveform display windows or numeric display windows are open, click the window you wish to print. Also, to print cursor values or statistics calculated over and area along with waveforms, display those windows as well.
3.10 Printing the Data 1 Print Example • When only the waveforms are printed 2 File information 3 Viewer 4 5 App Note If you wish to arrange the waveform graphs vertically when printing waveforms of multiple recording intervals, choose Tile Vertical under Graph/Sheet Layout from the Window menu. To arrange the waveform graphs horizontally, choose Tile Horizontally.
3.
Chapter 4 4.1 Calibrator Connecting the MW100 Data Acquisition Unit 1 Notes before Using the Calibrator • If connected to the MW100 from a browser, drop the connection before connecting with the Calibration Software. Also, place the MW100 in Calibration mode. To enter Calibration mode, turn OFF the power to the MW100 main unit, then turn it back ON again while holding down the USER 1 key. Release the USER 1 key one second or more after the self check begins (the 7-segment LED displays ).
4.1 Connecting the MW100 Data Acquisition Unit When the connection is established, information about the unit’s module configuration is displayed.
4.1 Connecting the MW100 Data Acquisition Unit 1 Setting a Password for Startup You can use the following procedure to set up the Calibrator so that it prompts the user to enter a password upon startup. 2 1. From the File menu, click Set Password. he password setting dialog box opens. 3 2. Click the New Password box, and enter a password. 3. Enter the same password in the Confirm New Password box, then click OK.
4.2 Calibration Procedure Notes on Calibration • Do not perform other operations during calibration. Take extra care because if you perform another operation while calibration is in progress, the module may suffer a break down. • When the screw terminal block (model 772080) is connected to the 10-CH MediumSpeed Universal Input Module, the terminal arrangement differs from that of clamp terminals.
4.2 Calibration Procedure 2. On the calibration detail setup screen that appears, select the channel and range to be calibrated and click the >> button. 1 The figure below is an example of the 4-CH, High-Speed Universal Input Module.
4.2 Calibration Procedure The figure below is an example of the 6-Channel, Medium-Speed, 4-Wire RTD Resistance Input Module. Channels are not selected. Items to be calibrated You can also click to select Select the measurement range to be calibrated from the list To move to the calibration execution screen 1 The figure below is an example of the 4-CH, Medium-Speed Strain Input Module. Channels are not selected.
4.2 Calibration Procedure 3. After making the connections according to the explanation given on the calibration execution screen 1, click the Calibrate button. For the 8-CH Medium Speed Analog Output module, after entering settings according to the explanation given on the calibration execution screen 1, click the Calibrate button. The figure below is an example of the 4-CH, High-Speed Universal Input Module. 1 2 Exp.
4.2 Calibration Procedure The figure below is an example of the 8-CH, Medium-Speed Analog Output Module. Exp. Calibration execution screen 1 Start calibration Return to the previous screen Return to the Unit Information screen When you click the Calibrate button, a message “Please wait and do not perform any other operation.” appears. When the calibration completes successfully, the calibration execution screen 2 appears. If the calibration fails, a message “Failed to calibrate.” appears.
4.2 Calibration Procedure 4. After making the connections according to the explanation given on the calibration execution screen 2, click the Calibrate button. 1 The figure below is an example of the 4-CH, High-Speed Universal Input Module. 2 Exp. Calibration execution screen 2 3 4 Calibrator 5 Start calibration App The figure below is an example of the 8-CH, Medium-Speed Analog Output Module. Exp.
4.
4.
Chapter 5 5.1 Troubleshooting Troubleshooting 1 If servicing is necessary, or if the instrument is not operating correctly after performing the corrective actions below, contact your nearest YOKOGAWA dealer for repairs. 2 The 7-segment LED does not illuminate. Probable Cause Corrective Action/Description Reference Page The power switch is not ON. Turn ON the power switch. * 3 The supply voltage is too low.
5.1 Troubleshooting The MX100 cannot be detected from the PC or cannot be detected with the Search button. Probable Cause Corrective Action/Description Reference Page The LINK LED does not turn ON. The cable is broken. Replace the Ethernet cable. * The LINK LED does not turn ON. There is a problem with the hub. Check the hub’s power supply. If it still does not work, replace the hub and check the hub’s operation. * The LINK LED does not turn ON. There is a problem with the PC.
5.1 Troubleshooting The connected input/output module is not detected. Probable Cause Module connection or module startup error. Attached the module while the power was ON. The PC software, main module, and input/output module style and release number rule is not upheld. Corrective Action/Description Turn OFF the power. Detach the input/output module once and attach it again. Check the PC software release number and main module style number before upgrading the version. [PC software release no.
5.2 Error Messages and Their Corrective Actions Error Messages on the Address Setting Software Error Code Message Corrective Action/Description Reference Page - IP address is invalid. Enter the correct IP address. 2-3 - Subnet mask is invalid. Enter the correct subnet mask. 2-3 - Default gateway is invalid. Enter the correct gateway address. 2-3 W5000 Address setting failed.
Appendix Appendix 1 Configuring/Removing the Firewall 1 Check the following before attempting to configure or remove a firewall. • Check the internet connection status using the ping command. If the ping fails, check the cables, hub, IP address settings, and other factors to determine the cause. • Check that procedures performed on the software are correct. If the problem cannot be solved after taking the above measures, it is likely that there will be problems with the firewall settings.
Appendix 1 Configuring/Removing the Firewall On Windows XP SP3 1. From the Start menu, choose Control Panel. The Control Panel window appears. 2. Double-click Windows Firewall. The Windows Firewall dialog box opens. 3. If Off is selected, click Cancel to exit. If On is selected, clear the Don’t allow exceptions check box.
Appendix 1 Configuring/Removing the Firewall 1 4. Click the Exceptions tab, then click the Add Program button. 2 3 4 5 5. Select MW100 IP Config and click OK. App Appendix Index 6. Click the Exceptions tab, check that MW100 IP Config has been added, select the MW100 IP Config check box, and click OK.
Appendix 1 Configuring/Removing the Firewall On Windows Vista 1. Click Control Panel on the Windows Start menu. The Control Panel appears. 2. Click Allow a program through Windows Firewall. The User Account Control dialog box appears. 3. Click Continue. The Windows Firewall Settings dialog box is displayed.
Appendix 1 Configuring/Removing the Firewall 1 4. Click the General tab. If Off is selected, click Cancel to exit. If On is selected, clear the Block all incoming connections check box. 2 3 4 5 App Appendix 5. Click the Exceptions tab, then click the Add program button. The Add a program dialog box is displayed. Index 6. Select MW100 IP Config, then click the OK button.
Appendix 1 Configuring/Removing the Firewall 7. Click the Exceptions tab. Confirm that the MW100 IP Config item was added, then select the MW100 IP Config check box and click the OK button.
Appendix 1 Configuring/Removing the Firewall 1 On Windows 7 1. Click the control panel on the Windows Start menu. The Control Panel appears. 2 3 2. Click System and Security. 4 5 App Appendix Index 3. Click Windows Firewall. The Windows Firewall Settings dialog box is displayed.
Appendix 1 Configuring/Removing the Firewall 4. Click Advanced settings. 5. Click Windows Firewall Properties. 6. Click the tab of the profile appropriate for your operating environment. When the Firewall state is Off, click Cancel to exit. When the Firewall state is On, and Inbound connections or Outbound connections is Block, proceed to next step.
Appendix 1 Configuring/Removing the Firewall 1 7. Click Inbound Rules. 2 3 4 5 8. Select the Program check box. Click Next.
Appendix 1 Configuring/Removing the Firewall 9. Select the This program path check box. Select MWIPSetE.exe from the software’s installation folder and click Next. 10. Select the Allow the connection check box. Click Next.
Appendix 1 Configuring/Removing the Firewall 1 11. Specify the profiles for which this rule applies. Click Next. 2 3 4 5 App 12. Specify the name of this rule, and click Finish. Appendix Index 13. Follow the same procedure as the one in step 7 and select MWCalibE.exe. 14. For Outbound Rules as well, follow the same procedure as the one in step 7 and select MWIPSetE.exe and MWCalibE.exe.
Index Index 1 A L adding marks........................................................................ 3-11 address setting screen.......................................................... 2-2 Address Setting Software...................................................... 1-1 alarm/mark list display......................................................... 3-12 alarm list.............................................................................. 3-12 applying data file display conditions..............