User's Manual Model AV550G Zirconia Oxygen Analyzer Averaging Converter IM 11M12D01-01E IM 11M12D01-01E 3rd Edition
Introduction The EXAxt Series AV550G Zirconia Oxygen Analyzer Averaging Converter is designed for oxygen measurement at multiple points in flue ducts of industrial furnaces and can be used to optimize the combustion process. For the AV550G system, various types of EXAxt ZR Series detectors as well as optional accessories are available. The best measurement can be achieved by selecting instruments appropriate to your application.
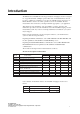
This manual consists of twelve chapters. Please refer to the reference chapters for installation, operation and maintenance. Table of Contents Chapter Outline 1. Overview Equipment models and system configuration examples 2. Specifications Standard specification, model code (or part number), 3. Installation dimension drawing for each equipment Installation method for each equipment 4. Piping Examples of piping in three standard system 5.
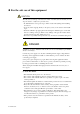
r For the safe use of this equipment CAUTION The cell (sensor) at the tip of the detector is made of ceramic (zirconia element). Do not drop the detector or subject it to pressure stress. • Do NOT allow the sensor (probe tip) to make contact with anything when installing the detector. • Avoid any water dropping directly on the probe (sensor) of the detector when installing it. • Check the calibration gas piping before introducing the calibration gas to ensure that there is no leakage of the gas.
(2) Safety and Modification Precautions • Follow the safety precautions in this manual when using the product to ensure protection and safety of personnel, product and system containing the product. (3) The following safety symbols are used on the product as well as in this manual. DANGER This symbol indicates that the operator must follow the instructions laid out in this manual in order to avoid the risk of personnel injury electric shock, or fatalities.
• Special descriptions in this manual This manual indicates operation keys, displays and drawings on the product as follows: • Displays on the panel 0 0. (Ex. message display (Ex.
r NOTICE • Specification check When the instrument arrives, unpack the package with care and check that the instrument has not been damaged during transportation. In addition, please check that the specification matches the order, and required accessories are not missing. Specifications can be checked by the model codes on the nameplate. Refer to Chapter 2 Specifications for the list of model codes.
d Yokogawa does not warrant conformance with the specific application at the user site. Yokogawa will not bear direct/indirect responsibility for damage due to a specific application. d Yokogawa Electric will not bear responsibility when the user configures the product into systems or resells the product. d Maintenance service and supplying repair parts will be covered for five years after the production ends.
viii IM 11M12D01-01E
Contents Introduction ........................................................................................................................... i rFor the safe use of this equipment .......................................................................... iii r NOTICE .................................................................................................................... vi rAfter-Sales Warranty ................................................................................................
3.1.7 Detector with a probe protector (Model ZO21R-L-hhh -h *B for dust wear protect ............................ 3-5 3.2 Installation of the Detector (Model ZR22G-015) ........................................... 3-6 3.2.1 Installation Location ................................................................................ 3-6 3.2.2 Usage of the High-temperature Probe Adapter (Model ZO21P-H) ....... 3-6 3.2.3 Probe Insertion Hole ............................................................................
5.2.8 5.2.9 Wiring for Solenoid Valve for Automatic Calibration ......................... 5-12 Wiring for Individual/Common Error Contact Outputs and Common Contact Outputs .............................................................. 5-13 5.2.10 Wiring for Contact Inputs ..................................................................... 5-15 5.3 Wiring and Piping Examples ........................................................................ 5-16 5.3.1 Wiring and Piping for Automatic Calibration ...
8.2.2 Alarm Delay Time and Hysteresis (Applies to All Alarm Settings) ...... 8-9 8.3 Assigning Contact Outputs ........................................................................... 8-13 8.4 Assigning Contact Inputs .............................................................................. 8-15 8.5 Other Settings ................................................................................................ 8-17 8.5.1 Date and Time ..................................................................
10.3.2 Selecting Language ............................................................................... 10-9 10.3.3 LCD Auto Off ..................................................................................... 10-10 10.3.4 Display Contrast Adjustment .............................................................. 10-10 10.3.5 Tag Name Entry .................................................................................. 10-10 10.4 Indication Check ....................................................
12.2 Displays and Remedies When Alarms are Generated ............................... 12-7 12.2.1 Alarm Types ....................................................................................... 12-7 12.2.2 Alarm Displays ................................................................................... 12-8 12.2.3 Remedies when Alarms are Generated .............................................. 12-9 12.3 Countermeasures When Measured Value Shows Error ........................... 12-16 12.3.
1. Overview 1. Overview Zirconia oxygen analyzers are used in combustion facilities to measure the flue gas oxygen concentration. Boiler operators use the oxygen measurement to optimize fuel usage, minimize atmospheric emissions and reduce energy consumption. A multiple point oxygen measurement system may be required for situations when gas stratification in the flue duct affects combustion control. The AV550G Averaging Converter can accept inputs from up to eight zirconia oxygen detectors.
ZR22G Detector (max. 8 detectors) Cell output, thermocouple output, cold contact compensation (0.75mm2, 6-core) Heater (1.
1. Overview 1.2 System Components 1.2.1 System Components and Their Applicability Item Model / Part Number/ System 1 System 2 Specifications Manual Calibration Automatic Calibration Averaging Converter AV550G-h (A or B) s s Detector See §1.2.
1-4 IM 11M12D01-01E
2. Specifications 2. Specifications This chapter describes the specifications for the following: ZR22G General-use separate-type detector (See Section 2.2.1) ZO21R-L Probe protector (See Section 2.2.2) ZR22G (0.15 m) High-temperature separate-type detector (See Section 2.3.1) ZO21P-H Adapter for High temperature probe (See Section 2.3.2) AV550G Averaging converter (See Section 2.4) ZA8F Flow setting unit (See Section 2.5.1) Other equipment (See Section 2.6) 2.1 General Specifications 2.1.
(Excluding the case where the reference air flow is natural convection) (Use oxygen of known concentration (in the measuring range) as the zero and span calibration gas.) 61% Maximum value of range setting ; from 0 to 5 vol% O2 to 0 to 25 vol% O2 range (Sample gas pressure: within 64.9 kPa) 63% Maximum value of range setting ; from 0 to 25 vol%O2 to 0 to 50 vol% O2 range (Sample gas pressure: within 60.
2. Specifications 2.2 General-use Separate-type Detector and Related Equipment General-use separate-type detector ZR22G can be used in combination with the probe protector ZO21R-L (see Section 2.2.2). 2.2.1 ZR22G General-use Separate-type Detector Sample Gas Temperature: 0 to 7008C (Probe only) It is necessary to mount the cell using Inconel cell-bolts when the temperature is 6008C or greater. 700 to 14008C (with High Temperature Probe Adapter) For high-temperature sample gas, apply 0.
Terminal Box Case: Material; Aluminium alloy Terminal Box Paint Color: Case; Off-white (Munsell 0.6GY3.1/2.0) Cover; Moss green (Munsell 2.5Y8.4/1.2) Finish: Polyurethane corrosion-resistant coating Gas Connection: Rc1/4 or 1/4FNPT Wiring Connection: G1/2, Pg13.5, M20 by 1.5 mm, 1/2 NPT Installation: Flange mounting Probe Mounting Angle: Horizontal to vertically downward. When the probe insertion length is 2 m or less, can install at angles from horizontal to vertically downward.
2. Specifications d Model and Codes Style: S2 Option code Suffix code Model ZR22G Separate type Zirconia Oxygen/ High Temperature Humidity Analyzer, Detector -015 -040 -070 -100 -150 -200 -250 -300 -360 -420 -480 -540 Wetted material -S -C 0.15 m (for high temperature use) (*1) 0.4 m 0.7 m 1.0 m 1.5 m 2.0 m 2.5 m (*2) 3.0 m (*2) 3.6 m (*2) 4.2 m (*2) 4.8 m (*2) 5.
EXTERNAL DIMENSIONS 1. Model ZR22G Separate type Zirconia Oxygen Analyzer, Detectors L 283 to 292 85 [124 [50.8 t L=0.15, 0.4, 0.7, 1.0, 1.5, 2.0, 2.5, 3.0 3.6, 4.2, 4.8, 5.4 (m) Rc1/4 or 1/4NPT Reference air inlet 155 to 163 69 C 2-G1/2,2-1/2NPT etc.
2. Specifications Model ZR22G...-P (with pressure compensation) Separate type Zirconia Oxygen Analyzer, Detectors 303 L 85 [124 [50.8 t L=0.4, 0.7, 1.0, 1.5, 2.0, 2.5, 3.0, 3.6, 4.2, 4.8, 5.4 (m) Rc1/4 or 1/4NPT Reference air inlet L 156 87 C 2-G1/2, 2-1/2NPT etc.
2.2.2 ZO21R-L Probe Protector This probe protector is required for the general-use detector when it is used for oxygen concentration measurements in powdered coal boilers or in fluidized furnaces to prevent abrasion due to dust particles when gas flow exceeds 10 m/s. When using a ZR22G general-use separate-type detector in the horizontal position, be sure to select a probe protector ZO21R-L-hhh-h*B to support the probe. Insertion Length: 1.05 m, 1.55 m, 2.05 m. Flange: JIS 5K 65A FF SUS304.
2. Specifications 2.3 High-Temperature Separate-type Detector and Related Equipment 2.3.1 ZR22G (0.15m) High-Temperature Separate-type Detector Standard Specifications Construction: Water-resistant, non-explosionproof Probe length: 0.15 m Terminal box: Aluminium alloy Probe material: Probe material in contact with gas: SUS 316 (JIS) (Probe), SUS 304 (JIS) (Flange), Zirconia (Sensor), Hastelloy B, (Inconel 600, 601) Weight: Approx.
2.3.2 ZO21P-H Adapter for High-Temperature Probe The probe adapter is used to lower the sample gas to a temperature below 7008C (below 3008C at probe adapter surface) before it is fed to the detector. Insertion length: 1 m, 1.
2. Specifications External Dimensions Unit: mm Approx. 351 Measured gas outlet Flange (Thickness) JIS 5K 32 FF Gasket (Thickness 3) 180 fA Flange <1> Approx. 48 110 f124 f60.5 85 f115 f60.5 Detector (ZR22G) Flange provided by customer 69 Reference air inlet <2> f52 over 42 25 170 Approx, 100 (Insertion length) (Note1) Approx, 215 R1/2 (Note2) Pipe hole (2-G1/2,2-1/2NPT.
2.4 AV550G Averaging Converter 2.4.1 Standard Specification Compatibility of Detectors : ZR22G, ZO21D, ZO21DW Number of Detectors : 1 to 8 Expandable up to 8 Bases, these for 4CH and 8CH are available Averaging interval : 0.2 seconds Display: 5.
2. Specifications Safety and EMC conforming standards Safety: Conforms to EN 61010-1: 2001 CSA C22.2 No.1010.1 certified UL 61010B-1 certified EMC: Conforms to EN 61326: 2002 AS/NZS CISPR II Maximum Distance between Probe and Converter: Conductor two-way resistance must be 10V or less (when a 1.25mm2 cable or equivalent is used, 300 m or less) Construction: Indoor installation Wiring Connection: Number of wire holes 30 pieces Wire hole size: [17 mm for grommet [6 to [12 mm for cable gland (option).
Maintenance Functions: Can operate updated data settings in daily operation and checking. Display data settings, calibration data settings, blowback data settings, current output loop check, input/output contact check. Setup Functions: Initial settings suit for the plant conditions when installing the converter. Equipment settings, current output data settings, alarm data settings, contact data settings, other settings.
2. Specifications Independent Output; Output to each channel Range; any setting between 0 to 5 through 0 to 100 vol% O2 in 1 vol% O2, or partial range is available (Maximum range value/minimum range value 1.3 or more) For the log output, the minimum range value is fixed at 0.1 vol% O2. 4 to 20 mA DC linear or log can be selected. Input/output isolation. Output damping: 0 to 255 seconds.
FOUNDATION Fieldbus communication function The bi-directional digital communication as standard for FOUNDATION Fieldbus that is established by Fieldbus foundation. Interface : FOUNDATION Fieldbus H1 (communication speed : 31.25 kb/s) Physical layer type : 113 (standard-power signaling, bus powered, non I.S.) Communication line condition: power supply----9 to 32 VDC, current supply----15 mA (Max) Signal insulation : communication terminal to grand terminal, dielectric strength 500 Vrms (50/60 Hz, 1 min).
2. Specifications d Model and Suffix Code 1. Detector Refer to GS 11M12A01-01E for a detailed explanation of the detector specifications and available accessories. 2.
• External Dimensions Unit: mm 480 465 R3 165.1 R3 .5 R3 17.3 35.5 150 .5 R3 480 (without cable gland and grommet) 266.7 300 5 R3. 166.5 457 4-knobs Extension view Distance between mounting hole 465 7 10-M5 holes 150 165.1 300 266.7 6 200 Maintenance space 200 800 300 200 • AV550G Standard Accessories Name Part No Quantity Remarks Fuse A1112EF 2 2.5A L9827AS 1 Hexagonal Allen Wrench For lock screw. T01.
2. Specifications 2.5 ZA8F Flow Setting Unit 2.5.1 ZA8F Flow Setting Unit This flow setting unit is applied to the reference gas and the calibration gas in a system configuration (System 1). This unit consists of a flow meter and flow control valves to control the flow of calibration gas and reference air. Standard Specifications FIowmeter: Calibration gas; 0.1 to 1.0 l/min. Reference air; 0.1 to 1.0 l/min.
• External Dimensions Unit: mm f6 hole 180 7 140 REFERENCE CHECK ZERO SRAN Zero gas outlet Span gas inlet Zero gas inlet 26 Reference air outlet 222.8 235.8 REFERENCE 20 35 35 35 35 20 8 35 70 4-Rc1/4 Piping connection port Instrument air inlet CHECK OUT Flow meter REF OUT Flow meter AIR IN ZERO GAS IN SPAN GAS IN Instrument air Approx 1.5 l/min. Airset Air pressure ; without check valve ; measured gas pressure 1 approx.
2. Specifications 2.6 Other Equipment 2.6.1 Dust Filter for the Detector (Part No.: K9471UA) This filter is used to protect the detector sensor from a corrosive dust component or from a high concentration of dust when the oxygen concentration in utility boilers or concrete kilns are to be measured. This filter requires a measurement gas flow of 1m/sec or faster, for circulation of the gas in the sensing part.
2.6.3 Auxiliary Ejector for High Temperature (Part No. E7046EC or E7046EN) This ejector is used where pressure of measured gas for high temperature detector is negative. This ejector consists of an ejector assembly, a pressure gauge and a needle valve. Standard Specifications Ejector Assembly Ejector Inlet Air Pressure: 29 to 68 kPa G Air Consumption: Approx.
2. Specifications E7046EC ; Piping connections, Rc1/4( p part) or Rc1/4( pp part ), E7046EN ; Piping connections,1/4NPT female ( p part) or 1/4NTP male( pp part ) Pressure gauge 39 f63f4 or 1/4 inch, conduit (stainless) Needle valve f43 Approx.88 Ejector assembly Height when fully open Approx.67 lnstrument air inlet PT 1/2 male Approx. 70 pp Detector 38 p p p 40 Not included in high temperature use auxiliary ejector. 20 Auxiliary ejector for high-temperature mounting place use.
< Pressure setting for the auxiliary ejector for high-temperature use > Pressure supply for the auxiliary ejector should be set so that the suction flow of the measured gas becomes approximately 5 l/min. To set this, proceed as follows: (1) In Graph 4, draw a horizontal line from the 5 l/min point. on the vertical axis (Suction flow: Qg) toward the gas pressure line to be used, to find the point of intersection.
2. Specifications 2.6.5 Check Valve (Part No. K9292DN or K9292DS) This valve is mounted on the calibration gas line in the system such as the one using flow setting units for manual calibration or the one performing when unburnt gas is generated. This valve prevents the process gas from entering the calibration gas line. Although it functions as a stop valve, operation is easier than a stop valve as it does not require opening/closing at each calibration.
2.6.6 Air Set This set is used to lower the pressure when instrument air is used as the reference and span gases. • Part No.K9473XH or K9473XJ Standard Specifications Primary Pressure: Max. 2 MPa G Secondary Pressure: 9.8 to 196 kPa G Connection: Rc1/4 or 1/4NPT(F) (includes joint adapter) Weight: Approx.1 kg Part No. Description K9473XH Joint: Rc 1/4, Material: Aluminum K9473XJ Joint: 1/4 NPT (F) , Material: Body; Aluminum, Adapter; SUS316 T2.11E.
2. Specifications • Part No. G7004XF or K9473XG Standard Specifications Primary Pressure: Max. 1 MPa G Secondary Pressure: 20 to 500 kPa G Connection: Rc1/4 or 1/4 FNPT with joint adapter Part No. Description G7004XF Joint: Rc 1/4, Material: Zinc Alloy K9473XG Joint: 1/4 FNPT , Material: Zinc Alloy with adapter T2.13E.EPS d External Dimensions Unit : mm View A Panel cut dimensions Horizontal mounting 22 Vertical mounting [15 40 +0.5 2-2.2 -0 40 2-[6.5 max.
2.6.7 Zero Gas Cylinder (Part No. G7001ZC) The gas from this cylinder is used as the calibration zero gas and detector purge gas. Standard Specifications Capacity: 3.4 l Filled pressure: 9.8 to 12 MPa G Composition: 0.95 to 1.0 vol% O2 in N2 (Note) Export of such high pressure filled gas cylinder to most countries is prohibited or restricted. 485 325 Unit : mm [140 2.6.8 Weight : Approx. 6 kg F213E.EPS Cylinder Regulator Valve (Part No.
2. Specifications 2.6.9 Calibration Gas Unit Case (Part No. E7044KF) This case is used to store the zero gas cylinders. Standard Specifications Case Paint: Baked epoxy resin, Jade green (Munsell 7.5 BG 4/1.5) Installation: 2B pipe mounting Material: SPCC (Cold rolled steel sheet) Weight: 3.6 kg, Approx. 10 kg with gas cylinder (Note) Export of such high pressure filled gas cylinder to most countries prohibited or restricted.
2.6.10 Model ZR22A Heater Assembly Style: S2 Model Suffix code Heater Assembly for ZR22G ZR22A Length (p1) Description Option code 0.15 m 0.4 m 0.7 m 1m 1.5 m 2m 2.5 m 3m -015 -040 -070 -100 -150 -200 -250 -300 Jig for change with Jig None -A -N Reference air (*3) (*2) -A Reference air Natural convention External connection (Instrument air) -B -C Pressure compensated (for ZR22G S2) Pressure compensated (for ZR22G S1) p1 Suffix code of length should be selected as same as ZR22G installed.
2.
3. Installation 3. Installation This chapter describes installation of the following equipment: Section 3.1 Detector (except model ZR22G-015) Section 3.2 Detector (model ZR22G-015) Section 3.3 Averaging Converter Section 3.4 ZA8F Flow Setting Unit Section 3.5 Calibration Gas Unit Case (E7044KF) 3.1 Installation of the Detector 3.1.
(1) Do not mount the probe with the tip higher than the probe base. (2) If the probe length is 2.5 meters or more, the detector should be mounted vertically (no more than a 58 tilt). (3) The detector probe should be mounted at right angles to the measurement gas flow or the probe tip should point downstream. Figure 3.1 illustrates an example of the probe insertion hole.
3. Installation 3.1.4 Installation of the Dust Filter( Part No K9471UA), etc CAUTION • The dust filter is used to protect the Zirconia sensor from corrosive dust or a high concentration of dust such as in utility boilers and concrete kilns. If a filter is used in combustion systems other than these, it may have adverse effects such as response delay. These combustion conditions should be examined carefully before using a filter. • The dust filter requires gas flow of 1 m/sec.
3.1.5 Procedures for installing the dust guard protector (K9471UC) The ZR22G detector is shipped with the dust guard protector when the option code “/ F2” is specified in case of ordering the detector. The protector should be used when preventing dusts and water drops from lowering the detector performance is desired. Screw the protector on the top of the detector so as to cover the top.
3. Installation 3.1.7 Detector with a probe protector (Model ZO21R-L-hhh-h *B for dust wear protect The detector is used with a probe protector to prevent the sensor from being worn by dust particles when there is a high concentration of dust and gas flow exceeds 10m/s (fine-carbon boiler or fluid-bed furnace). (1) Put a gasket (provided by the user) between the flanges, and mount the probe protector in the probe insertion hole.
3.2 Installation of the Detector (Model ZR22G-015) 3.2.1 Installation Location This model detector is used with the High-temperature Probe Adapter (Model ZO21P-H) when the temperature of sample gas exceeds 7008C, or when it is required due to maintenance spaces. The following should be taken into consideration when installing the detector: (1) Easy and safe access to the detector for checking and maintenance work.
3. Installation (1) When the furnace pressure is negative, raise the analyzer pressure to increase induction flow of the measurement gas. Refer to Section 2.6.3, Auxiliary Ejector for High-temperature Use, for the setting of induction flow. If there is much dust in the gas, the ejector may become clogg is induction flow increases.
3.2.4 Mounting of the High-Temperature Detector Note Ceramic (zirconia) is used in the sensor (cell) portion on the detector probe tip. Care should be taken not to drop the detector during installation. The same applies to a probe made of silicon carbide (SiC). A gasket should be used on the flange surface to prevent gas leakage. The gasket material should be selected depending on the characteristics of the measurement gas. It should be heatproof and corrosion-proof.
3. Installation 3.3 Installation of the Averaging Converter The averaging converter is designed for indoor installation and should be installed in the instrument panel in a control room. For outdoor installation, the averaging converter should be installed in an outdoor instrument panel protected from direct sunlight and the weather. DANGER High voltages are present inside the averaging converter.
3.3.1 Installation Location Follow the guidelines below when selecting a location for the averaging converter. (1) The touch screen display should be clearly visible and easily accessible for key operation: the display at eye level is recommended. (2) A wall or construction should be strong enough to support the weight of the converter. (3) The converter should be easily accessible for inspections and maintenance.
3. Installation Unit: mm 6-M5 screws 300 [267] 150 [165] Note: Dimensions in inches are given in parentheses. 465 F3302.EPS Figure 3.8 Mounting holes (2) Preventing Excessive Temperature Rise in an Instrument Panel Use a cooling method such as one of those shown in Figure 3.9 if there is a danger of the temperature inside an instrument panel exceeding the temperature range limits.
3.3.3 Outdoor Installation The averaging converter is designed for indoor installation. For outdoor installation, the averaging converter should be housed in an outdoor case protected from direct sunlight and the weather. The outdoor case should be equipped with a cooling system for controlling the internal temperature, if necessary. Also, the outdoor case should be installed in a location that keeps the case free from corrosive gases or dust.
3. Installation 3.4 Installation of ZA8F Flow Setting Unit 3.4.1 Location The following should be taken into consideration: (1) Easy access to the unit for checking and maintenance work. (2) Near to the detector and the converter (3) No corrosive gas. (4) An ambient temperature of not more than 558C and little changes of temperature. (5) No vibration. (6) Little exposure to rays of the sun or rain. 3.4.
(1) Make a hole in the wall as illustrated in Figure 3.11. Unit : mm 223 140 4 - f6.5 hole, or M6 screw F3.13E.EPS Figure 3.11 Mounting holes (2) Mount the flow setting unit. Remove the pipe mounting parts from the mount fittings of the flow setting unit and attach the unit securely on the wall with four screws. F3.14E.EPS Figure 3.
3. Installation 3.5 Installation of the Calibration Gas Unit Case The calibration gas unit case is used to store the G7001ZC zero gas cylinders. 3.5.1 Location The following should be taken into consideration: (1) Easy access for cylinder replacement (2) Easy access for checking (3) Near to the detector and converter as well as the flow setting unit. (4) The temperature of the case should not exceed 408C due to rays of the sun or radiated heat. (5) No vibration 3.5.
3-16 IM 11M12D01-01E
4. Piping 4. Piping This chapter describes piping procedures for the AV550G Zirconia Oxygen Analyzer Averaging Converter system based on two typical system configurations. 4.1 Piping for a System Using Flow Setting Units for Manual Calibration The piping for a system using flow setting units for manual calibration is shown in Figure 4.1. ZR22G Detector (max. 8 detectors) Cell output, thermocouple output, cold contact compensation (0.75mm2, 6-core) Heater (1.
The following outlines some points to note regarding the piping for this system. • Install a stop valve through a nipple on the calibration gas inlet of the detector. Note: The stop valve should be connected directly to the detector. If any piping is present between the detector and the stop valve, condensation may develop in the pipe, causing damage to the detector by rapid cooling when the calibration gas is introduced.
4. Piping 4.1.1 Parts Required for Piping in a System Using Flow Setting Units for Manual Calibration Referring to Table 4.1, check that the parts required for your system are ready. Table 4.
4.1.3 Piping for the Reference Gas This piping is to be installed between the zero gas cylinder and the ZA8F flow setting unit, and between the ZA8F flow setting unit and the ZR22G detector. The cylinder should be placed in a calibration gas unit case or the like to avoid any direct sunlight or radiant heat so that the gas cylinder temperature does not exceed 408C. Mount a regulator valve (specified by YOKOGAWA) on the cylinder.
4. Piping Reducing nipple (R1/2-R1/4 or R1/2-1/4NTP) Needle valve F4.4E.EPS Figure 4.4 Mounting the needle valve for restricting exhaust flow of the sample gas Cover flange Sample gas outlet Adapter for high temperature probe Detector Insulating material Probe F4.5E.EPS Figure 4.
4.1.5 Pipinf for Blowback This piping is required when the blow back function is carried out. The piping described below provides automatic blow back operation when the “ blow back start “ command is entered to the converter. Blowback air Regulator valve Solenoid valve Solenoid valve Pipe coupling Note Blow pipe If blowback is done under control of a contact output from the averaging converter, a hold is placed on analog output signals from all detector while blowback is in progress. See Section 10.
4. Piping 4.1.6 Piping for Indication check To perform an indication check using the third check gas, the piping to allow the third gas to flow into the calibration gas line is required for the ZA8F Flow Setting Unit in addition to the system configuration shown in Figure 4.1. Connect the piping from the third check gas cylinder through a pressure reducing valve and a stop valve, along with the span gas line, to the zero gas inlet of the ZA8F Flow Setting Unit.
4.1.7 Piping to Introduce Purge Gas When a Process Gas Alarm Occurs When a process gas alarm (an input contact signal of unburnt gas detection) occurs, the averaging converter will cut off the power supply to the heater of the detector, and at the same time it will send a contact output to activate a solenoid valve for introducing a purge gas to the detector. In addition to the system configuration shown in Figure 4.
4. Piping 4.2 Piping for a System to Perform Automatic Calibration The piping for a system to perform automatic calibration is shown in Figure 4.10.
4.2.1 Parts Required for Piping in a System to Perform Automatic Calibration Referring to Table 4.2, check that the parts required for your system are ready. Table 4.
4. Piping 4.2.2 Piping for the Calibration Gases The piping for the calibration gases should be installed between the calibration gas cylinders (or instrument air source) and the detectors with a flowmeter, solenoid valves, needle valves, and stop valves for performing automatic calibration. • Place the calibration gas cylinders in a place not exposed to direct sunlight as much as possible, e.g., house in a gas unit case.
4.2.3 Piping for the Reference Gas The piping for the reference gas should be installed between the air source (instrument air) and the detector through flowmeters and needle valves for flow control of the reference air, and an air set. • Install the piping from the reference gas inlet of the detector to the air source with a flow meter, a needle valve where necessary, and an air set in this order. • Install the flowmeter, needle valve and air set in close proximity.
4. Piping 4.2.7 Piping to Introduce Purge Gas When a Process Gas Alarm Occurs When a process gas alarm (an input contact signal of unburnt gas detection) occurs, the averaging converter will cut off the power supply to the heater of the detector, and at the same time it will send a contact output to activate a solenoid valve for introducing a purge gas to the detector.
4-14 IM 11M12D01-01E
5. Wiring 5. Wiring This chapter describes the wiring connections to the EXAxt AV550G Averaging Converter. 5.1 General DANGER * Never apply power to the averaging converter and other instruments connected to the averaging converter until all wiring is completed. WARNING • This product complies with the CE marking. Where compliance with the CE marking is necessary, the following wiring is required. 1. Install an external switch or circuit breaker to the power supply of the averaging converter. 2.
5.1.1 Wiring Precautions 5.1.1.1 Precautions Concerning the Correspondence Between Detectors and Channel Cards Multiple detectors are connected to the averaging converter. Make sure that the wiring is run properly between the detector and its corresponding channel card on the averaging converter. Special care should be exercised so that the channel number of the detector signal line from the channel card corresponds the one of the detector heater line from the power supply unit.
5. Wiring Good Cores Bad To Terminals To Terminals Shield Long Cable Shield Ground Terminal Short Cable Sheath Wiring Holes Figure 5.1 Shield Processing Cable Shield Groud Terminals (M4) Figure 5.
5.1.2 Wiring Holes The averaging converter has 30 wiring holes. Use holes near the rear for power wiring (e.g., power cables, detector heater wires, and wiring for solenoid valve contacts and other contact outputs). For signal wiring (e.g., detector signal lines and analog output signal lines), use holes near the front. If more than 30 cables are used and thus more than one cable has to be passed through one wiring hole, do not allow signal lines and power lines to pass the same hole.
5. Wiring 5.1.4 Types of Wiring and Cables Types of wiring and cables to be used are listed in Table 5.1. The purpose of a shield is not only to prevent the effect from noise disturbance but also to restrict the noise emitted from the converter. Specified cables must be used. Table 5.
5.2 Wiring for the Averaging Converter and Peripheral Devices 5.2.1 Preparation for Wiring to the Averaging Converter Follow the instructions below when connecting cables to the averaging converter. (1) The terminal screws on the control and channel cards are M3.5, and all the other terminal screws are M4. Each wire should be terminated with a crimp terminal appropriate to the screw.
5. Wiring The sizes of the terminal screws are M3.5. Each wire should be terminated with a crimp terminal appropriate to the screw. WARNING • If the ambient temperature at the detector installation site exceeds 608C, use bare crimp terminals. • Before opening the detector cover, loosen the lock screw. If the screw is not loosened first, the screw will damage the cover, and the terminal box will require replacement.
5.2.3 Power and Ground Wiring Connect the power wiring to the L and N terminals in the averaging converter. Use wires with a size of 2 mm2 (14 AWG) or larger. If a cable gland is not installed on the wiring hole of the averaging converter, use a wire with an outside diameter of 17 mm or smaller. If installed, use a wire with an outside diameter of 6 to 12 mm. A lock washer must be installed.
5. Wiring Detector #1 Averaging Converter Basic Power Unit CH1 CH2 CH3 ZR22G /ZO21D CH4 51 52 53 54 55 56 57 58 7 8 Shield Detector #2 Detector #3 Detector #4 Figure 5.7 Power Wiring to Detector Heaters If the ambient temperature at the detector installation site exceeds 80˚C, install a terminal box and connect to the detector using 600 V silicon rubber insulated glass braided wires. The distance between the detector and the terminal box should be minimized.
5.2.5 Signal Wiring to Detectors This wiring is for transmitting signals of cell electromotive force, thermocouple output and cold junction compensation from a detector to the averaging converter. Use 6-core shielded PVC insulated PVC sheathed control cables. The conductor two-way resistance should be 10 Ω or less. Keep the cables away from the power wiring. If a cable gland is not installed on the wiring hole of the averaging converter, use a wire with an outside diameter of 17 mm or smaller.
5. Wiring If the ambient temperature at the detector installation site exceeds 80˚C, install a terminal box and connect to the detector using 600 V silicon rubber insulated glass braided wires. The distance between the detector and the terminal box should be minimized.
5.2.7 Wiring for Individual and Average Concentration Analog Outputs For the signal wiring to analog outputs, use shielded PVC insulated PVC sheathed control cables. The number of cores is determined by the number of outputs. If a cable gland is not installed on the wiring hole of the averaging converter, use a wire with an outside diameter of 17 mm or smaller. If installed, use a wire with an outside diameter of 6 to 12 mm.
5.
Use PVC insulated PVC sheathed control cables for the wiring for these outputs. There is no need to use shielded cables. If a cable gland is not installed on the wiring hole of the averaging converter, use a wire with an outside diameter of 17 mm or smaller. If installed, use a wire with an outside diameter of 6 to 12 mm.
5. Wiring 5.2.10 Wiring for Contact Inputs The averaging converter receives contact inputs to perform the specified functions. Follow the instructions below to run the wiring for contact inputs. Use 2-core or 3-core PVC insulated PVC sheathed control cable for this wiring. The number of cores is determined by the number of contacts to be used. There is no need to use shielded cables.
5.3 Wiring and Piping Examples 5.3.
5. Wiring 5.3.
5-18 IM 11M12D01-01E
6. Components 6. Components In this Chapter, the names and functions of components are described for the major equipment of the AV550G Averaging Converter. 6.1 ZR22G Detector 6.1.1 General-purpose Detector (except for Model ZR22G-015) Terminal box, Non explosion-proof JIS C0920 / equivalent to IP44D. Equivalent to NEMA 4X/IP66 (Achieved when the cable entry is completely sealed with a cable gland in the recirculation pressure compensated version.) Probe this part is inserted in the furnace.
6.1.2 High-Temperature Detector (Model ZR22G-015) Sample gas outlet When a negative measurement gas pressure is used, connect the auxiliary ejector assembly. When the measurement gas is high-temperature and high-pressure, and does not fall below 7008C, connect a pressure control valve (e.g. a needle valve). (Refer to Section 3.2.2.
6. Components 6.2 AV550G Averaging Converter 6.2.1 Components and Function Status Display Lamps Control Card Controls averaging calculations, autocalibration and display functions Frame Touch Screen Display Displays data and allows interactive touch screen operation. Channel Cards Green, continuous: Channel card is active Specified number of channel cards is Orange, continuous: Alarm condition installed.
On this display, touch the indication area (enclosed by dotted line) of the desired channel. A display shown in bottom in Figure 6.4 will appear. This display will show the oxygen concentration (or cell temperature during warm-up) and average concentration data (groups a, b, and c) (show “---” if all channels are in warm-up period) of the selected channel, which is called a single-channel display. To return to the previous multi-channel display, touch the area enclosed by dotted line.
6. Components Table 6.1 Types of Status Indication Markings Marking Purge Warmup Condition Displayed if any of the calibration gas channels is being purged. Displayed if any channel is in warmup status. If any other channel is in Purge status then Purge status display takes preference. Channel is in calibration period: calibration gases are being CAL.TIME introduced. CHK.TIME Channel is in check period: check gases (including 3rd check gas) are being introduced. Blow.
6.2.2.3 Display Configuration Display configuration is shown below. Tag: Ch1 Tag: 21.0 Ch1 21.0% Ch6 21.0% 21.0% Ch3 % O2 21.0 %O2 21.0 %O2 21.0 %O2 Ave-a Ave-b Ave-c Ch5 21.0% Ch2 Ch7 21.0% 21.0% Ch4 Ch8 21.0% 20.7% + Channel Indication Area Execution/Setup 25%O2 Ch1 Execution 0 . 9 mV Cell voltage: 2 9 . 4 mV Thermo voltage: C.J.resistance: 1 1 7 0 . 2 V Cell temperature: 7 5 0 8C C.J.
6. Components 6.2.2.4 Display Functions 1) Basic panel display (Displays measured oxygen concentrations, and cell temperatures during warm-up period.) The basic panel display consists of a multi-channel display and a single-channel display. The multi-channel display screen shows cell temperatures during warm-up period and oxygen concentrations afterward.
2) Detailed data display To move to the detailed data display, touch the Detailed Data key and then touch the indication area of the desired channel in the multi-channel display, or simply touch the Detailed Data key in the single-channel display. The detailed data display shows maintenance data, such as cell electromotive force, cell temperature, and calibration history, per channel Tag: Ch1 Ch5 21.0% 2 Ch2 Tag: Ch1 1 21.0% Ch6 21.0% Ch3 21.0% Ch7 21.0% Ch4 21.0% Ave-a Ave-b Ave-c Ch8 21.
6. Components 4) Execution/Setup display Touch the Setup key on the basic panel display. The Execution/Setup display will appear. From the menu items — calibration, indication check, blow back, maintenance, or commissioning, select the desired item to perform. Execution/Setup Execution Calibration r Indication check r Blow back Setup r Maintenance r Commissioning Enter F06E.EPS Figure 6.10 Execution/Setup Display 5) Calibration display From the menu on the Execution/Setup display, select Calibration.
8) Maintenance display From the menu on the Execution/Setup display, select Maintenance. The Maintenance display will appear. The following can be performed from the menu on this display. 1. 2. 3. 4. Display setup Calibration, indication check, and blowback setups mA-output loop and contact checks Channel card power 9) Commissioning display From the menu on the Execution/Setup display, select Commissioning. The Commissioning display where parameter setups can be selected will appear.
6. Components To enter a password (in combination with text data, numeric values and codes), the alphabetic character entry panel display first appears. If you press any numeral key (0 to 9), the current display then changes to the numeric-value entry panel display, enabling you to enter numeric values. If you press the “other” key, the current display then changes to the code-entry display, enabling you to enter codes. These displays alternate between the three. Figure 6.
6.3 ZA8F Flow Setting Unit Reference gas flow setting valve Span gas flow setting valve Zero gas flow setting valve Flow meter for reference gas Flow meter for calibration gas F6.4E.EPS Figure 6.
7. Startup 7. Startup This section explains the startup procedures for the Averaging Converter: supplying power, setting parameters as required, and performing manual calibration. 7.1 Startup procedure The startup procedure is as follows: CAUTION If you connect Model ZO21D* detectors, then you need to change the detector parameters. Before connecting power, refer to: Sect. 7.4 Setting Detector Model.
7.2 Check Piping and Wiring Check piping and wiring (refer to Sec. 4 for piping, and Sec. 5 for wiring). 7.3 Set Valve type Set valves (which depend on your system configuration) as follows: 1) If there is a shutoff valve at the calibration gas inlet, shut it.
7. Startup 7.4 Setting Detector model The default detector model set before shipment from the factory is ZR22G. If you plan to use the "ZO21D*" then before starting warmup you need to change the default setting. If you do not change the setting before starting warmup then detector temperature control will not work properly and serious damage to the detector may result.
[Disconnect power to the heater; this will generate an error ] If you disconnect the signal wiring from the detector then this will generate an error, but this allows you to change the detector model settings without detector warm up. 1) Remove all thermocouple (TC) signal wiring from channel cards which connect to ZO21D detectors. 2) Apply power to the averaging converter. 3) Error messages are displayed for these channels, but you can set their parameters.
7. Startup 7.5 Supply Power to Averaging Converter CAUTION To avoid temperature changes around the sensor, it is recommended that (rather than turning it on and off) power be continuously supplied to the Oxygen Analyzer if it is used in an application where it is used periodically. It is also recommended to flow a span gas (instrument air) beforehand. Before connecting power check that power switch is set to "O (Off)". After connecting power. Turn power switch to "I (On)".
7.6 Selection of Gas to be Measured Exhaust gas includes steam resulting from combustion of hydrogen and oxygen. You may choose whether to display the oxygen concentration including the oxygen contained in the steam, or display the computed "dry" oxygen concentration (a value compensated for the oxygen in steam) which results in a higher concentration value. For details, refer to " Fuel Settup" in Sec. 8.5.3 1) Touch the Setup key to switch to the [Execution/Setup] display.
7. Startup 7.7 Current Output Range Setting The output ranges (two ranges) of each channel are independently settable. Ranges are switched by contact input. Contact OFF results in Range 1, and contact ON results in range 2. For details, refer to Sec. 8.5 Setting Contact Inputs. Shipping time default is for each range to be set to 0 to 25% O2. The ratio of the maximum range setting to the minimum is restricted as described in Sec. 8.1 Setting Analog Outputs.
7.8 Averaging Group Setting This instrument can determine oxygen concentration average for three averaging groups a, b, and c. a and b can each be arbitrary channel groupings, and the corresponding averages are output. c output is (a+b) /2. Select the groupings for a and b as per the procedure below. 1) Touch the Setup key to switch to the [Execution/Setup] display. 2) From the [Commissioning] display select [Average group setup], then [Average group -a]. Fig. 7.8 shows the display.
7. Startup 7.9 Calibration To calibrate this instrument, the procedure is to measure zero gas and span gas and set the instrument to read the known concentrations. The procedure for both zero and span calibration, or for either zero or span calibration, can be performed manually from the touch display, or can be performed semi-automatically using contact signal inputs to start calibration, (allowing preset calibration and stabilization times), or it can be performed automatically at preset intervals.
7.9.2 Performing Manual Calibration 1) Confirm that the zero gas flow setting valve is fully closed, then adjust supply gas pressure to measurement gas pressure + 50kPa (but a maximum of 300 kPa) using the valve on the gas cylinder. 2) Touch [Setup] on the touchdisplay to switch to the [Execution/Setup] display. 3) Touch [Calibration] and the Calibration display appears. 4) Touch [Manual calibration] then the [Enter] key. The Channel Select display shown in Fig. 7.10 appears. Manual cal.
7. Startup 8) Open the span gas flow setting valve, and adjust flow to 600 660 ml/min. 9) Select [Valve opened (Start Calibration)] and touch the [Enter] key. An oxygen concentration graph like Fig. 7.13 is displayed, and [CAL.TIME] status mark flashes. Wait for the graph measured value trace to stabilize. Calibration has not yet been performed, so it is not a problem if the displayed value is different from the correct value of span gas concentration. Channel No.
14) Select [Valve opened (Start Calibration)] and touch the [Enter] key. An oxygen concentration graph like Fig. 7.15 is displayed, and [CAL.TIME] status mark flashes. Wait for the graph measured value trace to stabilize. Calibration has not yet been performed, so it is not a problem if the displayed value is different from the correct value of zero gas concentration. Ch1 Manual cal. 1min./div. 21.00% 0.98% 0.98 %O2 CAL. TIME Enter F7.15E.EPS Fig. 7.
7. Startup 7.10 Analog Output Current Loop Check After wiring the cables you can perform a loopback check to check if you can output a specified current from the analog output terminals. 1) Touch [Setup] on the touchdisplay to switch to the [Execution/Setup] display. 2) Select [Maintenance] and touch the [Enter] key. 3) From the Maintenance display select [mA-output loop check], and touch the [Enter] key. 4) The "mA-output loop check" channel-select display appears (Fig. 7.17).
7.11 Checking Operation of Contact Input, Contact Output After wiring the cables you can perform a contact I/O check to display the status of contact inputs and to check the operation of contact outputs including contact outputs to operate solenoid valves during autocalibration. 7.11.1 Contact Output Operation Check 1) 2) 3) 4) Touch [Setup] on the touchdisplay to switch to the [Execution/Setup] display. Select [Maintenance] and touch the [Enter] key.
7. Startup 7.11.2 Checking contacts used to operate solenoid valves during autocalibration 1) From the Contact check display of Fig. 7.18 select [Solenoid valve contacts]. From the corresponding Solenoid valve contact select display of Fig. 7.20 select the solenoid to check. To check the Autocalibration gas switching valve, select [Com]. Touching the Enter key opens the [Span] (Span valve open) / [Zero] (Zero valve open) selection window.
7-16 IM 11M12D01-01E
8. Detailed Data Setting 8. Setting Operating Parameters - Detail, and Examples 8.1 Setting Analog Outputs 8.1.1 Analog Output Range (Per-Channel) The analog output range is defined by setting the oxygen concentration value corresponding to the range minimum oxygen concentration (corresponding to 4 mA output) and the oxygen concentration value corresponding to the range maximum oxygen concentration (corresponding to 20 mA output). For each channel the range settings can be set independently.
The range low and high values are restricted as follows: The range min. O2 concentration value (corresponding to 4 mA output) can be set to either 0% O2 or in the range 6 to 76% O2. The range max. O2 concentration value (corresponding to 20 mA output) can be set to any value in the range 5 to 100% O2, however the range max. setting must be at least 1.3 times the range min. setting.
8. Detailed Data Setting 8.1.2 Output Hold Setting (Applies to All Outputs) During warmup, during calibration, and when an error occurs, output hold status applies: the analog output is held at a preset value. In this instrument, the permissible hold values which may be set are shown in Table 8.1 . The hold setting applies to the outputs of all channels.
2) (Under) Maintenance "Under maintenance" is the time that starts when you move to the Execution/Setup display by touching the Setup key on the basic panel display and ends when you return to the basic panel display. It includes when you operates keys on lower level menu displays of the Execution/Setup display. 3) (Under) Calibration For Manual Calibration "Under calibration" is the time that starts when you move to the Manual cal display (Figure 8.
8. Detailed Data Setting 4) Under Indication Check For Manual Indication Check "Under indication check" is the time that starts when you move to the Manual ind. check display (Figure 8.6) from the Indication check display, lasts you operating keys for performing indication check manually, and ends when a preset hold time has elapsed. Ch1 Manual ind. check Open span gas valve. Set flow span gas to 600ml/min. Start ind. check r Cancel ind. check Enter F36E.EPS Fig. 8.
5) During Blowback For Semi-Automatic Blowback When blowback is started from the Blowback display, "during blowback" is the time that starts when you touch the Enter key on the Blowback display with Start blow back selected (Figure 8.8), lasts while blowback is being performed for all installed channels, and ends after a preset hold time has elapsed.
8. Detailed Data Setting 1) From "mA-output setup" on the Commissioning display, select "mA-outputs hold" and touch the Enter key. A display like Fig. 8.9 is displayed. 2) Select an item you want to change, and touch the Enter key. 3) In the selection window that appears, select the desired Hold method and touch the Enter key. 4) Select other items as desired and set as desired, as in the previous step. If you select Preset Value then you can set a current output value.
8.1.3 Setting Output Smoothing Coefficient (Applies to All Analog Outputs) When the oxygen concentration in the measured gas fluctuates rapidly, if the measured value is used for control this can lead to problems with undesirable frequent ON/OFF switching. You can set a smoothing time constant of between 0 and 255 seconds to reduce the effect. A single time constant setting applies to all analog outputs.
8. Detailed Data Setting 8.2 Oxygen Concentration Alarm Setting You can set four oxygen concentration alarm settings: High High (HH), High (H), Low (L) and Low Low (LL). If an alarm occurs while the basic panel display is displayed then an alarm mark appears on the display, and at the same time the oxygen concentration display color of the channel in alarm status turns orange. An orange status display lamp also lights at the top of the corresponding channel card.
The action of delay and hysteresis are illustrated in Figure below. Alarm delay and hysteresis settings apply to all alarm settings for all channels and all averaging groups. Alarm range C B A D 7.5% High-limit alarm setpoint Hysteresis 2.0% 5.5% Oxygen concentration Delay time: Delay time: 5 seconds 5 seconds Delay time: 5 seconds Alarm output ON OFF F8.4E.EPS Fig.8.11 Alarm Output Action with Delay and Hysteresis Fig.8.11 shows an example with high alarm setting of 7.5% O2, alarm delay of 5 sec.
8. Detailed Data Setting Setting Alarm Hysteresis 3) From the Alarm Setup display select Hysteresis. A numeric entry display appears for you to enter the hysteresis value. The units are 0.1% O2. To enter 2.5% O2 enter 25. You can enter a hysteresis setting in the range 0 to 9.9% O2. Setting Alarm Delay Time 4) From the Alarm Setup display select Contact Delay. The numeric entry display is displayed for you to enter Alarm Action Delay time. Units are seconds. To set 3 sec., enter 003.
Alarm settings are set to defaults in Table 8.3 prior factory shipment or after data initialization. Table 8.3 Item Default Hysteresis Delay time High High (HH) Alarm HH Alarm Setting High (H) Alarm High Alarm Setting Low (L) Alarm Low Alarm Setting Low Low (LL) Alarm LL Alarm Setting 0.1% O2 3 sec. OFF 100% O2 OFF 100% O2 OFF 0% O2 OFF 0% O2 T8.3E.eps CAUTION If an alarm setting is OFF then the alarm is disabled. You need to turn alarms ON to enable them.
8. Detailed Data Setting 8.3 Assigning Contact Outputs The averaging converter provides the following outputs: 1) "Function" contact outputs (DO1~DO4): Function can be allocated by user. 2) Common (representative) error contact (DO5): Represents an error in any channel. 3) Individual channel error contacts (DO-CH1~DO-CH8): Individual channel error outputs, one per channel. For details of errors, refer to Sec. 12.1 Displays and Remedies When Errors Occur.
< Setting Procedure > 1) Touch the Setup key, and the [Execution/Setup] display appears. 2) From [Commissioning] select [Contact setup] and touch the Enter key. 3) Select contact no. to set up and touch the Enter key. 4) Select [Alarms] or [Others] and touch Enter key. You can set the condition(s) allocated to contact output. (Fig. 8.14). 5) Select ON/OFF pulldown to set items ON and allocate the corresponding condition to contact output.
8. Detailed Data Setting 8.4 Assigning Contact Inputs External contact inputs allow remote operation of the following functions shown in Table 8.6 . Table 8.6 Contact Input Functions Item Function Output Range Switching While contact signal is applied, output range 2 is selected and [Range] is displayed on the display. See Fig. 8.15. Contact input starts Semi-Automatic Calibration. Calibration Mode setting must be Semi-Auto or [Auto]. Contact signal must be applied for at least 1 sec.
This setting example shows how to set "When contact input 1 Opens, Start Semi-Auto Calibration". 1) From the panel basic display touch [Setup] key, and the [Execution/Setup] display appears. 2) Select [Commissioning] and the Commissioning display appears. 3) Select [Contact Setup] then [Input Contacts]. 4) Select [Input 1] . Function Selection window (Fig 8.16) appears. 5) Select [Calibration Start]. 6) For [Input contact 1] select (operate if) [Closed]. (You can select Open or Closed).
8. Detailed Data Setting 8.5 Other Settings 8.5.1 Date and Time Here we explain how to set date and time. Date and time setting are used for Auto Calibration and Auto Indication Check, also Auto Blowback Start time. 1) From the basic panel display if you touch the Setup key, the [Execution/Setup] display appears. 2) Select [Commissioning] and the Commissioning display appears. 3) Select [Others] and the display of Fig 8.17 appears. 4) Select [Clock] and the display of Fig 8.18 appears.
8.5.2 Average Value / Max. and Min. Monitoring Time This instrument can compute and display Average, Max. and Min. Oxygen concentrations in a specified time interval. The Average, Max. and Min. can apply to each channel and to averaging outputs a, b and c. Here we explain how to set the time interval for averaging, and for monitoring for Max./Min. 1) From the panel basic display touch [Setup] key, and the [Execution/Setup] display appears.
8. Detailed Data Setting 8.5.3 "Fuel" Setup: Humid Exhaust Gas or "Dry" Equivalent Oxygen Content This instrument can convert between "humid" gas measurements and "dry" equivalents: Y dry = y 100 - H gas X 100 (%) H gas : Water content of measured gas %H2O Y dry : Dry oxygen equivalent (%O2) Y : Oxygen concentration in moist gas (%O2) Fuelequ.eps To convert between "humid" and "dry" gas measurements, the water content H gas is computed.
For liquid fuel Amount of water vapor in exhaust gas (Gw) = (1/100) {1.24 (9h + w)} [m3 /kg] Theoretical amount of air (Ao) = {(12.38 / 10000) x H1} — 1.36 [m3 /kg] Low calorific power = H1 X value = {(3.37 / 10000) x Hx} — 2.
8. Detailed Data Setting 40 39 0.046 38 0.044 0.042 37 0.040 36 0.038 35 0.036 34 0.034 33 0.032 32 0.030 31 0.028 30 Wet-bulb temperature, 8C 29 0.026 Absolute humidity, kg/kg 28 0.024 27 26 0.022 25 0.020 24 0.018 22 20 0.016 18 0.014 16 0.012 14 12 0.010 10 0.008 8 4 2 0 6 0.006 0.004 -2 0.002 0 2 4 6 8 10 12 14 16 18 20 22 24 26 28 30 32 34 36 Dry-bulb temperature, 8C 38 40 0.000 F8.17E.EPS F8.22E.eps Fig. 8.
Table 8.7 Fuel Data d For liquid fuel Fuel Specific properties weight kg/l Type Chemical component (weight percentage) C h O Ash Higher Lower order w content order S N Calorific power Theoretical amount of kJ/kg air for combustion Nm3/kg Amount of combustion gas Nm3/kg CO2 H2O SO2 X value N2 Total Kerosene 0.78~ 85.7 14.0 0.83 0.5 0.0 0.0 46465 43535 11.4 1.59 1.56 0.00 9.02 12.17 0.96 Light oil 0.81~ 85.6 13.2 0.84 1.2 0.0 0.0 45879 43032 11.2 1.59 1.47 0.00 8.87 11.93 0.
8. Detailed Data Setting 1) Touch the Setup key on the basic panel display, and the [Execution/Setup] display appears. 2) Select [Commissioning] and the Commissioning display appears. 3) Select [Others] then [Fuel Setup] and the display of Fig. 8.21 appears. 4) Select [Content of moisture in exhaust gas] and [Theoretical air quantity] in turn and enter numeric data. 5) Select [more] and touch Enter key, and a display like Fig. 8.22 is displayed.
8.5.4 Setting Password Unauthorized access to lower level menu displays from the Execution/Setup display can be protected by passwords. You can set separate passwords for [Calibration, Indication Check, Blowback, and [Maintenance] and for [Commissioning] 1) From the basic panel display touch the Setup key, and the [Execution/Setup] display appears. 2) Select [Commissioning] , and the Commissioning display appears. 3) Select [Others] then [Passwords]. The display shown in Fig. 8.
9. Calibration 9. Calibration 9.1 Calibration Briefs 9.1.1 Principle of Measurement This section sets forth the principles of measurement with a zirconia oxygen analyzer before detailing calibration. A solid electrolyte such as zirconia allows the conductivity of oxygen ions at high temperatures.
120 100 0.51% 02,81.92mV(Zero origin of calibration) 80 60 Cell voltage (mV) 40 20 21.0% O2, 0mV (Span origin of calibration) 0 -20 -40 0.1 0.5 1 5 Oxygen concentration (vol %) 10 21.0 50 100 F9.1E.EPS Figure 9.1 Oxygen concentration in a Measurement Gas vs Cell Voltage (21% O2 Equivalent) The measurement principles of a zirconia oxygen analyzer have been described above. However, the relationship between oxygen concentration and the electromotive force of a cell is only theoretical.
9. Calibration 9.1.3 Compensation The deviation of a measured value from the theoretical cell electromotive force is checked by the method in Figure 9.2 or 9.3. Figure 9.2 shows a two-point calibration using two gases: zero and span. Cell electromotive forces for a span gas with an oxygen concentration p1 and a zero gas with an oxygen concentration p2 are measured while determining the calibration curve passing between these two points.
9.1.4 Characteristic Data from a Sensor Measured During Calibration During calibration, calibration data and sensor status data (listed below) are acquired. However, if the calibration is not properly conducted (an error occurs in automatic or semi-automatic calibration), these data are not collected in the current calibration. These data can be observed by selecting the detailed data display key from the basic panel display.
9. Calibration 9.2 Calibration Setup 9.2.1 Mode There are three calibration modes (for zero and span calibration): manual mode, semiauto mode (started from the display or started by contact input) using preset calibration time and stabilization (settling) time, and autocalibration at preset intervals. Restrictions related to each mode are described here. - When [Manual Mode] is selected In this mode, only Manual calibration can be performed.
9.2.2 Calibration Setup Procedure You can perform both Span and Zero calibration, or either one or the other. Normally select both: Span-Zero. From [Maintenance] --> [Calibration setup] display, select [Points], then a selection window opens and you can select Span-Zero, Span or Zero (Fig 9.5). Calibration setup r Mode: Auto Points: Span-Zero r Zero gas Span 98% Zero r Span gas conc: 2 1 . 0 0 % r Timing r Cal. history initialize Enter F9.5E.EPS Fig. 9.
9. Calibration 3) Calibration time setting If the mode is [Man]: Select [Hold time]. This is the output stabilization (settling) time required from calibration end until measurement mode is reentered. During this time, the calibration gas is switched to measurement gas and the measurement is allowed time to stabilize. Setting range is from 00min. 00 sec. to 60 min 59 sec.
If the mode is [Auto]: In addition to the above [Hold] output stabilization (settling) time and [Cal. time] setting, thereÅfs also Cal. [Interval], [Start date] and [Start time]. The Automatic Calibration Interval can be set in the range 00 days 00 hrs. to 255 days 23 hrs. Once Auto Calibration starts. It is performed for all installed channels, so the interval needs to be larger than the sum of span and zero calibration times plus settling times for all channels.
9. Calibration Table 9.1 When Auto Calibration conflicts with Other Commands Other commands Man. Cal. SemiAuto AutoCal Maintenance CAL chan. in warmup status Purging the channel Other channel CAL Indication Check in other channel Blowback in other channel x x x x x x x x x x Wait Wait Wait Wait Wait CAL chan. in ERR status CAL chan. now disabled x x x x x x x x x X : Cannot perform calibration Wait : Wait until other command finishes before starting calibration T9.1E.
9.3 Performing Calibration Note 1) Perform calibration under normal working conditions (e.g. continuous operation with sensor mounted on furnace). 2) Perform both Span and Zero calibration for best resultant accuracy. 3) When instrument air is used for the span calibration, remove the moisture from the instrument air at a dew-point temperature of -208 C and also remove any oily mist and dust from that air.
9. Calibration Starting Semi-Auto Calibration from the Display 1) From the basic display display if you touch the Setup key, the [Execution/Setup] display appears. Select [Calibration]. 2) Next select [Semi-auto calibration]. The [Semi-autocal] channel select display, Fig 9.8, is displayed. 3) Select the channel to be calibrated. The [Semi-auto cal.] display, Fig. 9.9, is displayed. 4) When you select [Start calibration] the [Semi-autocal] trend graph of Fig 9.
Starting Semi-Auto Calibration by a Contact input 1) Confirm that on the [Input contacts] display, [Calibration Start] is selected. 2) In Measurement mode (with the Basic display displayed) when the contact input is detected then Calibration starts. 3) To abort calibration, touch the reject key (door with arrow icon). If you abort Span or Zero calibration then calibration time is skipped and stabilization (settling) time starts.
10. Other Functions 10. Other Functions 10.1 Display On the basic panel display, touch the Detailed Data key to view detailed operational data (see Figure 10.1). On the detailed data display you can scroll up / down a page with the . and m keys, and you can switch to another channel with the b or c key . A detailed data display has 12 pages (screens) per channel. The following describes each data item. Ch1 0 . 9 mV Cell voltage: 2 9 . 4 mV Thermo voltage: C.J.resistance: 1 1 7 0 .
10.1.2 Thermocouple Voltage The cell temperature is measured with a Type K (chromel-alumel) thermocouple. The thermocouple cold junction is located in the detector terminal box. The cell temperature and the thermocouple voltage (including the voltage corresponding to the cold junction temperature) are displayed. 10.1.3 Cold Junction Resistance (C.J. Voltage) The ZR22 Detector measures the cold junction temperature using an RTD (Pt 1000).
10. Other Functions 10.1.7 Cell Response Time The cell’s response time is obtained in the procedure shown in Figure 10.3. If only either a zero-point or span calibration has been carried out, the response time will not be measured just as it will not be measured in manual calibration. Five minutes maximum Response time mA 100% 90% 10% of analog output span Time Start calibration Calibration complete The response time is obtained after the corrected calibration curve has been found.
10.1.10 Recommended Next Calibration Date Recording the cell emf at calibration time, and monitoring the drift in cell emf with time, gives an idea of how long it will take for measurement error to reach tolerance, and thus recalibration can be scheduled before that date. The tolerance is a maximum of 60.5% of range, so if range is 0-25% O2 then tolerance is 25% O260.5% = 0.125% O2. The instrument extrapolates a line through the most recent three cell emf readings (see Fig.10.
10. Other Functions 10.1.13 Ch. card Rev., Ctrl. card Rev. This shows the revision number of the channel card software and Control card software. 10.1.14 Maximum Oxygen Concentration The maximum oxygen concentration and the time of its occurrence during the period specified in the Averaging display are displayed. After the preset monitoring interval has elapsed, the maximum oxygen concentration that has been displayed so far will be cleared and a new maximum oxygen concentration will be displayed.
10.2 Trend Graphs Up to 11 user-selected data from among the individual outputs from each channel and average concentration outputs, groups a, b, and c, can be viewed in graphical form at a time in a single screen. To move to the trend graph display, touch the graph display key on a basic panel display. The cascade function may be used to view each trend line of channels clearly in the trend graph display. The function offsets the axes so that trend lines do not overlap. The following describes graph setup.
10. Other Functions 10.2.2 Time Axis of Trend Graph The time axis of the trend graph is determined by the sampling interval. For each channel, and for each division on the time axis, 60 data items can be plotted. If data is sampled at 10-second intervals then each division represents 60 x 10 = 600 seconds or 10 minutes (see Figure 10.6). The sampling interval can be set in the range 1 to 30 seconds.
10.2.3 Trend Graph Display Settings Selecting channels to be displayed 1) On the basic panel display, touch the Graph Display key to display the Trend Graph display. 2) If you touch anywhere in the Graph display area, the Graph Channel Select display will appear. The colors of the channel numbers correspond to the colors of the trend graphs. Grayed-out channels are not selected for display. 3) To suppress display of the Ave-a graph, move the pointer to [Ave-a] and touch the Enter key.
10. Other Functions 10.3 Other Display-related Functions 10.3.1 Auto-return Time On the Execution/Setup display or lower level menu displays, if no keys are touched for a preset time, the "auto-return" time, then the display will automatically revert to the basic panel display. The "auto-return" time can be set in the range 0 to 255 minutes. If it is set to 0, then the display does not automatically revert.
10.3.3 LCD Auto Off If no keys are touched during a preset time interval, then the display and backlight turn off. They are turned back on: 1) If you touch the screen. 2) If an error or alarm occurs. 1) From [Display setup] select [Lcd auto off time]. 2) Touch the Enter key and the numerical entry display appears. To set an "Lcd auto off" time of one hour, enter 060. 3) You can enter a value in the range 0 to 255 minutes. If you set 0 then the "Lcd auto off" function does not operate.
10. Other Functions 10.4 Indication Check In addition to zero and span calibration gases, you can select a third check gas for a 3point check. This is another check to determine if there is any discrepancy between the measured value and the certified concentration of the gas. 10.4.1 Mode There are three modes of indication check operation: manual, semi-automatic, and automatic. In Manual mode, zero, span, and third gas indication checks can be performed sequentially and manually.
10.4.2 Procedure for Performing an Indication Check You can perform two-point Span and Zero (Gas) Indication Checks, you can include a third gas and perform a three-point indication check, or you can check just one of the three points. Select [Points] on the Indication check setup display. A dropdown menu opens, allowing you to select the desired indication check point(s) from: [Span-Zero], [Span], [Zero], [Span-Zero-Third] or [Third] (Figure 10.10).
10. Other Functions 10.4.4 Setting Indication Check Timing All timing parameters set in the Calibration Setup display applies to indication check timing. The timing can also be set from the Indication Check Setup display. Note, however, that the timing parameters set in the Indication Check Setup display are reflected in the timing setting for calibration.
Indication chk start in Ch1 Span check Check time Ch1 Zero check Check time Ch1 3rd gas check Check time Ch1 output hold Ch. 1 Output Hold Hold time Ch2 Span check Check time Ch2 Zero check Check time Ch2 3rd gas check Check time Ch. 2 Output Hold Ch2 output hold Hold time Average output SV-Ch1 contact Ch1 removed from average Off Ch1 removed from average On Off SV-Ch2 contact On SV-Com contact Span gas ON 3rd gas contact Zero gas ON Off Span gas ON On Zero gas ON Off On F10.
10. Other Functions 10.4.5 Running an Indication Check 10.4.5.1 Manual Indication Check A manual indication check is performed by following prompts on the screen, and manually opening or closing valves of calibration gas or third check gas. When solenoid valves are used, valves are opened and closed automatically at the same time that messages appear on the screen. The procedure for indication check is virtually the same as for calibration.
Channel No. under calibration Setting value of span gas concentration Ch2 Manual ind. check 1min./div. 21.00% Setting value of zero gas concentration 0.98% Actual measurement value 20.9 %O2 CHK. TIME Enter F10.16E.EPS Fig. 10.16 Span Indication Check 9) If you touch the Enter key then span gas check ends and you are returned to the Check gas selection display. Close the span gas flow control valve and tighten the lock nut used to prevent it from loosening during measurement.
10. Other Functions Ch2 1min./div. 21.00% Manual ind. check Ch2 Manual ind. check 21.00% 1min./div. 0.98% 0.98% 9.05 %O2 CHK. TIME Enter 20.4 %O2 HOLD TIME Enter F10.19E.EPS F10.18E.EPS Fig.10.18 Third Gas Indication Check Fig. 10.19 Hold Time 10.4.5.2 Executing Semi-Auto Indication Check Semi-automatic indication check is started either from the display or by external contacts. When started from the display, only the channel selected on the display is checked.
Ch2 Semi-auto ind. chk 1min./div. 21.00% 0.98% 21.0 %O2 CHK. TIME F10.22E.EPS Fig.10.22 Indication Check Graph Starting Semi-auto Indication Check by a contact input 1) Confirm that on the Input contacts display, [Ind. check start] is selected for the contact to be used to start indication check. 2) When the contact input is detected then Indication check starts. 3) To abort Indication check, touch the Reject key.
10. Other Functions 10.5 Blowback This section explains the parameter settings for performing blowback. 10.5.1 Mode There are three modes of blowback operation: no function, semi-automatic, and automatic. Blowback is not performed when the mode is set to No Function. In Semi-auto mode, blowback can be started by key operation on the display or by a contact input signal, and then sequentially performed at a preset blowback time and hold time.
10.5.2 Setting Contacts for Operating Solenoid Valves The same contacts used for operating solenoid valves to perform channel switching during Auto-calibration (SV-CH1 to SV-CH8) are also used for starting and stopping blowback gas. Therefore, when both blowback and Auto/Semi-auto calibration are used, contact outputs used for operating solenoid valves need to be assigned as shown in Fig. ,10.24. Refer to Fig. 10.26 for blowback timing chart.
10. Other Functions 10.5.3 Setting Blowback Start Time * When mode is set to [Semi-auto]: Hold time and blowback time should be set. Hold time is the time required from the end of blowback to the restart of measurement. Set the time so that a sample gas that flows through the sensor after blowback can displace the blowback gas in the sensor and thus the output returns to normal. Setting range is from 00 minute 00 second to 60 minutes 59 seconds.
Table 10.5 When Auto Blowback conflicts with Other Processing Purging the channel Other channel CAL Indication Check in other channel Blowback in other channel Maintenance Chan. is in warmup status Chan. is in ERR status Chan. now disabled SemiAuto Blowback X X X X X s X X Auto Blowback Wait Wait Wait Wait Wait s X X s : Perform blowback T10.5E.eps X : Can’t perform blowback Wait : Wait until other ongoing command completion, and is executed.
10. Other Functions 10.5.4 Operation of Blowback Figure 10.26 shows blowback timing. To execute blowback by a contact input, use it with an on-time period of 1 to 11 seconds. Once blowback starts, the SV-CH contact output repeatedly opens and closes at an interval of approximately 10 seconds during the preset blowback time. During the blowback time and hold time on a channel, its individual analog output remains held at a value preset in the Output Hold Setup and excluded from averaging group calculations.
10.5.5 Performing Blowback 10.5.5.1 Semi-Auto Blowback Semi-auto blowback can be started from the display or by an external contact input. Starting blowback from the display 1) On the basic panel display, touch the Setup key to display the Execution/Setup display. Select [Blowback]. Next select [Blow back start] and touch the Enter key. Blowback is performed starting from Channel 1. 2) If a display like Figure 10.27 appears, then mode is set to [No function]. Refer to Section 10.5.
10. Other Functions 10.6 Purging At the beginning of calibration, condensation that has developed in the calibration gas piping may be blown onto the sensor, causing sudden cooling and damage to the sensor. Purging involves passing span calibration gas through the piping for a preset time before warmup, in order to remove any such condensation. If the cell temperature is 1008C or greater, then purging cannot be performed.
1) From the basic panel display, touch the Setup key to display the Execution/Setup display. 2) Select [Commissioning] and the Commissioning display appears. 3) Select [Others] then [Purging] and a display such as Fig. 10.30 is appears. 4) Touch the Enter key and a numerical entry display appears. Enter the desired purging time between 0 and 60 (minutes). If you enter 0 then purging is disabled.
10. Other Functions 10.7 Parameter Initialization Parameter settings can be initialized to the factory default settings. Initialization can be done for all parameters or for individual parameters. The parameters that can be initialized and their defaults are listed in Table 10.7. 1) On the basic panel display, touch the Setup key to display the Execution/Setup display. 2) Select [Commissioning], next [Others] then [Defaults]. A display like Figure 10.32.1 appears.
Table 10.7 Initialization Parameters and Defaults -part1 Item Initialization Parameter Display Trend Graph Tag name Displayed channels Default Deleted All ON Sampling interval 30 sec Graph upper limit 25.0% O2 Graph lower limit 0.0% O2 Auto Return Time 0 min. (disabled) Display contrast Medium Display Auto power off 0 min (disabled) CAL Indication Check Display language Not affected Mode Manual Points Span - Zero Zero gas concentration 1.00% O2 Span gas concentration 21.
10. Other Functions Table 10.8 Initialization Parameters and Defaults - part 2 Item Initialization Parameter Default Hysteresis 0.1% O2 Alarm contact action delay 3 sec Alarms High High Alarm OFF Alarm setting 100.0% O2 High Alarm OFF Alarm setting 100.0% O2 Low Alarm OFF Alarm setting 0.0% O2 Low Low Alarm OFF Alarm setting 0.
Table 10.9 Initialization Parameters and Defaults -part 3 Item Initialization Parameter Averaging. Others Fuel Setup Default Averaging interval 1 hour Max & Min Average monitoring Interval 24 hours Moisture content in exhaust gas Theoretical air volume X value Absolute humidity of outside atmosphere 0.00 m3/kg (m3) 1.00 m3/kg (m3) 1.00 0.
10. Other Functions 10.8 Methods of Operating Valves in the ZA8F Flow Setting Unit The ZA8F Flow Setting Unit is used for manual calibration as described in Section 1.1.1. Calibration in such a system is to be manually operated. So, you have to operate the valve of the Flow Setting each time calibration is made (starting and stopping the calibration gas flow and adjusting the flow rate). This applies even if you are using the ZR40H Autocalibration Unit. For operation of the converter, see Section 7.
10.8.3 Operating the Zero Gas Flow Setting Valve Operate the zero gas flow setting valve during zero-point calibration in the following procedures: (1) When the display shown in Figure 10.35 appears during calibration, open the zero gas flow setting valve of the flow setting unit and adjust the flowrate to 600 ml/min ± 60 ml/min. To rotate the valve shaft, if the valve has a lock nut loosen the lock nut and slowly turn it counterclockwise. To check the flowrate, monitor the calibration gas flow meter.
11. Inspection and Maintenance 11. Inspection and Maintenance This chapter describes the inspection and maintenance procedures that are performed to maintain reliable performance of the AV550G Averaging Converter and to keep it in good operating condition. The procedure for adding channel cards is also explained in this chapter. DANGER Do NOT touch the probe if it has been in operation immediately just before being checked. (The sensor at the tip of the probe heats up to 750 8C during operation.
11.1 Removing and Attaching the Front Cover 11.1.1 Removing the Front Cover 1) Loosen the 4 knob bolts by hand, and then loosen the lock screw with the Allen wrench supplied. 2) Remove the front cover by lifting up slightly then pulling away from the case. 11.1.2 Attaching the Front Cover 1) Attach the front cover, aligning the slots on the sides of the cover with the knob bolts on the case, and then pull the cover down until it is seated firmly.
11. Inspection and Maintenance Averaging Converter Channel Card Power Supply Circuit Detector CELL, TC, CJ Power supply wire for Heater F11.2E.eps Hot Swap Switch Mechanical Relays Fig. 11.2 1) On the basic panel display touch the Setup key. The Execution/Setup display will appear. 2) Use the Cursor key to move the cursor to Maintenance. Touch the Enter key. 3) On the Maintenance display, select Channel Card Power. Touch the Enter key. A display shown in Figure 11.3 will appear.
11.3 Inspection and Maintenance of the Detector 11.3.1 Cleaning the Filter in Sensor Assembly If the filter in the tip of the sensor assembly gets blocked by dirt or the like, this will affect measurement accuracy. If it cannot be cleaned satisfactorily by blowing compressed air through it, use a brush to clean it. 11.3.
11. Inspection and Maintenance 11.3.3 Replacing the Sensor Assembly CAUTION When replacing the sensor assembly, allow ample time for the sensor to cool : it operates at very high temperature. The performance of the sensor (cell) deteriorates as its surface becomes soiled during operation. Therefore, you have to replace the sensor when its life expectancy expires, for example, when it can no longer satisfy a zero-gas ratio of 100630 percent or a span-gas ratio of 0618 percent.
3. Part assembly procedure (1) First, install the contact. Being careful not to cause irregularities in the pitch of the coil spirals (i.e., not to bend the coil out of shape), place it in the ringed groove properly so that it forms a solid contact. Groove in which the contact (E7042BS) is placed F11.2E.EPS Figure 11.5 Installing the Contact (2) Next, make sure that the O-ring groove on the flange surface of the sensor is clean.
11. Inspection and Maintenance 11.3.4 Replacement of the Heater Unit This section describes the replacement procedure for the heater unit. The sensor or ceramic heater-furnace core internal structure is subject to fracturing, so do NOT subject it to strong vibrations or shock. Additionally, the heater unit reaches high temperatures and is subjected to high voltages. So, maintenance services should be performed after the power is off and the heater unit temperature has returned to normal room temperature.
16 A 14 p 14 11 10 12 14 p 35 p A 13 15 24 9 8 24 7 5 4 6 24 3 2 1 23 TC +(with Si TUBE) TC - View A-A 34 CELL + 17 28 26 18 29 19 1 CELL 2 3 TC 4 5 CJ 6 30 25 33 13 22 14 p p 37 p 20 32 7 H T R 8 21 F11.7E.EPS p 35 36 Figure 11.7 Exploded View of Detector (When pressure compensation specified) Note: The parts marked by * is not equipped with the types except the pressure compen-sation type.
11. Inspection and Maintenance Replacement of heater strut assembly (ZR22G : Style S2 and after) Refer to Figure 11.7 as an aid in the following discussion. Remove the cell assembly (6), following Section 11.3.2, earlier in this manual. Open the terminal box (16) and remove the three terminal connections – CELL +, TC + and TC -. Before disconnect the HTR terminals, remove the terminal block screw (28). Keeping the other terminal remaining to be connected. Disconnect the two HTR connections.
11.3.5 Replacement of filter assembly Set the filter assembly (1) in place using a special pin spanner (with a pin 4.5 mm in diameter: part no. K9471UX or equivalent). If a filter assembly that has already been replaced once is used again, apply grease (NEVER-SEEZ: G7067ZA) to the threads of the filter assembly. 11.3.6 Replacement of O-ring The detector uses three different types of O-rings (14), (21), and (22). One O-ring alone (14), or two O-rings (21) and (22) are used.
11. Inspection and Maintenance 11.3.8 Stopping and Re-starting Operation When operation is stopped, take care of the following so that the sensor of the detector cannot become unused. CAUTION When operating an instrument such as boiler or industrial furnace is stopped with the zirconia oxygen analyzer operation, moisture can condensate on the sensor portion and dusts may stick to it.
11.4 Inspection and Maintenance of the Averaging Converter The averaging converter does not require routine inspection and maintenance. This section describes inspections performed at the time of periodic maintenance service, part replacement, and addition of channel cards. 11.4.1 Fuse Replacement The averaging converter has fuses for detector heaters of channels CH1 to CH4 in the basic power supply unit and fuses for detector heaters of channels CH5 to CH8 in the expansion power supply unit.
11. Inspection and Maintenance Cap Flat-blade screwdriver Socket Fuse F11.6E.EPS Fig 11.9 WARNING If a replaced fuse blows out immediately, there may be a problem in the internal circuit of the averaging converter, the detector, or the wiring between the averaging converter and the detector. Carefully investigate the cause of fuse failure. If the cause is unknown, contact our service office.
11.5 Adding Channel Cards Detectors can be additionally connected to the averaging converter by installing more channel cards. Follow the procedure below to add a channel card. 1) Before the procedure, turn off the power to the averaging converter at the external breaker. 2) Remove the front cover, and position the power switch to "O (OFF)". 3) Remove the channel slot cover from the desired channel by removing the screws holding the cover to the slot.
11. Inspection and Maintenance 11.6 Adding the Expansion Power Supply Unit To connect more than 4 detectors to a 4-channel base averaging converter (AV550G-A), the expansion power supply unit is required to be installed as well as addition of channel card(s) described in Section 11.5, "Adding Channel Cards.". Follow the procedure below to add the expansion power supply unit. 1) Before the procedure, turn off the power to the averaging converter at the external breaker.
11.7 Replacing Limited Life Components The following components have limited life time. It is recommended that these components be replaced at an approximate interval of 5 years. 1) LCD panel 2) Switching power supply, 2 types (located on the left side of the frame, not visible from outside.) For replacement of these components, contact our service office. When the control card or basic power supply unit breaks down, also contact our service office for repair. .
12. Troubleshooting 12. Troubleshooting This chapter describes errors and alarms detected by the self-diagnostics function of the averaging converter. It also explains inspections and remedies when other problems occur. 12.1 Displays and Remedies When Errors Occur 12.1.1 Error Types An error occurs when an abnormality is detected in the detector or averaging converter, e.g., in the cell (sensor), detector heater, or internal circuits of the averaging converter.
12.1.2 Operations When an Error Occurs When an error occurs, the averaging converter operates as follows. When a channel-specific error occurs: 1) The power to the heater of the corresponding detector is removed. 2) On the multi-channel display, a red error code is indicated under the relevant channel and an error icon flashes in the switch indication area (Figure 12.1).
12. Troubleshooting 12.1.3 Error Displays By touching the error icon when an error occurs, detailed error descriptions can be displayed. Use the Next key to move to the next page if the error descriptions are displayed in multiple pages. On the detailed error description display, touch the Update key to update the error occurrence condition. When an error and an alarm occur at a time, an error icon takes precedence. Channels Where Errors Occur (displayed in red) Tag: Ch1 Ch5 Err2 0.96% Ch2 Ch6 0.
12.1.4 Remedies When an Error Occurs 1) Error 1 Cell Voltage Failure Error-1 occurs when the cell (sensor) voltage input to the converter falls below -50 mV (corresponding to about 200% O2).
12. Troubleshooting 2) Error 2: Heater Temperature Failure Possible causes of heater temperature failure This error occurs if the detector heater temperature does not rise during warm-up, falls below 7308C after warm-up, or exceeds 7808C. When Error 2 occurs, Alarm 5 (cold junction temperature alarm) may be generated at the same time. Be sure to touch the error icon to get the error description and confirm whether or not this alarm is being generated simultaneously.
3) Error 3: Cannel card failure This indicates that the channel card with an error has failed to operate properly. Replace the channel card. Before replacing the channel card, be sure to turn off power to the channel card to be replaced by hot swap function. 4) Error 4: Control card failure This indicates that the control card has failed to operate properly. Contact our service office.
12. Troubleshooting 12.2 Displays and Remedies When Alarms are Generated 12.2.1 Alarm Types The following types of alarms may be generated by the averaging converter. If an alarm is generated, actions such as turning off the heater power are not carried out. The alarm is canceled when the cause of the alarm is removed. Alarm 5 (cold junction temperature alarm) may be generated concurrently with Error 2 (heater temperature error). In this case, the operation when the error occurs has priority.
12.2.2 Alarm Displays By touching the alarm icon when an alarm is generated, detailed alarm descriptions can be displayed. Use the Next key to move to the next page if the alarm descriptions are displayed in multiple pages. On the detailed alarm description display, touch the Update key to update the alarm occurrence condition. When an error and an alarm occur at a time, an error icon takes precedence. Table12.
12. Troubleshooting 12.2.3 Remedies when Alarms are Generated 1) Alarm 1: Oxygen concentration alarm See Subsection 8.2, "Setting Oxygen Concentration Alarms.". 2) Alarm 2: Zero-point calibration coefficient alarm In automatic or semi-automatic calibration, Alarm 2 is generated when the zero correction factor is out of the range of 100 630% (refer to Subsection 9.1.3, "Compensation"). The following are possible causes of this alarm.
4) Check whether the deterioration of or damage to the sensor assembly that caused the alarm, has occurred suddenly during the current calibration by following the procedure below. a. Call up the Detailed Data display. b. Use the Page Scroll key to check Calibration Data (Figure 12.9). The span and zero correction factors of the last ten calibration can be checked here. By checking these data, whether the sensor deterioration has occurred suddenly or gradually can be determined.
12. Troubleshooting 3) Alarm 3: Span-point calibration coefficient alarm In automatic or semiautomatic calibration, this alarm is generated when the span correction factor is out of the range of 0 6 18% (refer to Section 9.1.3, “Compensation”). The following are suspected as the cause: (1) The oxygen concentration of the span gas does not agree with the value of the span gas set “Calibration setup.” (2) The flow of the span gas is out of the specified flow value (600 mL/min 660 mL/ min).
5) Alarm 5: Cold junction temperature alarm This alarm is generated when the temperature of the cold junction located at the terminal block of the detector falls below -258C or exceeds 1558C. Check the following: Display “C.J.Temperature” in the detailed data display. If “C.J.Temperature” is indicated as 2008C or -508C, the following can be considered. (1) Breakage of the cold junction signal wires between the converter and the detector, or the cable is not securely connected to the connecting terminals.
12. Troubleshooting (3) If there is no failure in the wiring, the electrical circuits inside the converter may possibly fail. Contact the service personnel at Yokogawa Electric Corporation. CAUTION • The operating temperature range of the Model ZO21D Detector is -108 C to 808 C (except for the high-temperature detector ZO21D-H).
cell emf 1st calibration Example: When the second calibration result is compared with the first, the change in slope indicates sensor degradation. 2nd calibration However, when the third calibration result is compared with the second, the slope has not changed, only the zero offset, suggesting clogging and pressure effects 3rd calibration 0.51% O2 value 21% F12.11E.eps Fig. 12.
12. Troubleshooting (5) Alarm setting (a) From the basic screen, touch the setup key to display the [Execution / Setup] screen. (b) Select [Setup] to display the Setup screen. (c)Select [Other] the [Asymmetry alarm]. The screen below is displayed. (d) From the [Enable/Disable] window, select [Enable] and touch Enter. Asymmetry alarm See Manual for details ! Asymmetry alarm Disable Enable Enter F12.13E.EPS Fig. 12.
12.3 Countermeasures When Measured Value Shows Error The causes that the measured value shows an abnormal value is not always due to instrument failures. There are rather many cases where the causes are those that measuring gas itself is in abnormal state or external causes exist, which disturb the instrument operation. In this section, causes of and measures against the cases where measured values show the following phenomena will be described. (1) The measured value is higher than the true value.
12. Troubleshooting 12.3.2 Measured Value Lower Than True Value (1) The measuring gas pressure becomes lower. Where an increment of the measured value due to pressure change cannot be neglected, take measures referring to subsection 12.3.1 (1). (2) Moisture content in a reference gas changes (decreases) greatly.
12-18 IM 11M12D01-01E
Customer Maintenance Parts List Model AV550G Averaging Converter 3 DO1 DO2 COM NC NO COM NC NO 11 12 13 14 15 16 DO-CH1 DO-CH2 COM NC NO COM NC NO 31 32 33 34 35 36 DO3 COM NC NO 17 18 19 DO-CH3 COM NC NO 37 38 39 DO4 DO5 COM NC NO COM NC NO 20 21 22 23 24 25 DO-CH4 SV-COM COM NC NO 40 41 42 43 44 45 SV-CH1 SV-CH2 26 27 SV-CH3 28 29 SV-CH4 46 48 47 49 DO-CH5 COM NC NO 61 62 63 DO-CH7 COM NC NO 81 82 83 DO-CH6 COM NC NO 64 65 66 DO-CH8 COM NC NO 84 85 86 SV-CH5 SV-CH6 67 68 69 70 SV-CH7
Customer Maintenance Parts List Model ZR22G Zirconia Oxygen Analyzer, Detector (Separate type) A 13 A 1 13 View A-A 2 7 6 5 4 3 9 10 11 8 12 F02E.EPS Parts No. MS-code Qty.
Customer Maintenance Parts List Model ZO21DW-L Zirconia Oxygen Analyzer Detector (Pressure balance type) 13 1 11,12 8 5 7 6 4 3 2 9 10 Item Part No.
Customer Maintenance Parts List Model ZO21P-H Zirconia Oxygen Analyzer High Temperature Probe Adaptor 5,6 4 7 3 8,9,10 ZR22G 2 1 Item Parts No. Qty. Description 1 E7046AL E7046BB E7046AP E7046AQ E7046AD 1 1 1 1 1 Probe (SiC, L=1.0m) Probe (SiC, L=1.5m) Probe (SUS, L=1.0m) Probe (SUS, L=1.
Customer Maintenance Parts List E7046EC/E7046EN Zirconia Oxygen Analyzer Auxiliary Ejector (for Model ZO21P-H) 1 3 2 4 5 Item 1 2 3 4 5 6 7 6 7 Parts No. Qty.
Revision Record Manual Title : Model AV550G Zirconia Oxygen Analyzer Averaging Converter Manual Number : IM 11M12D01-01E Edition Date Remark (s) 1st Aug. 2004 Newly published 2nd Oct. 2004 Asymmetry alarm added. Figure 8.17, Table 12.2 and 7) of Sec 12.2.3 changed. 3rd Sep. 2005 Revised Section Introduction: Added description. r For the safe use of this equipment: Added description in DANGER. r After-Sales Warranty: Added description regarding modification. Section 1.1.1, Figure 1.