
User guide


4-10
M-4659
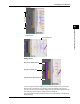
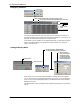
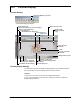
Displaying Multiple Y-axis
When multi-axis zone is selected, the Y-axis scales corresponding to the [Y-Axis] boxes
in the [General Display Settings] that are checked will be displayed.
• Adding a Y-axis • Deleting a Y-axis
Drag and drop
Drag and drop
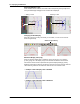
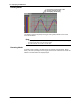
Changing the Grid Display
Select the grid type by clicking Grid density on the toolbar, or Y-axis on the menu bar.
Switch the grid density.
Switch the grid density
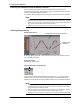
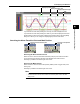
WaveformDisplayLimit(clip)
When the waveform display limit is enabled by clicking the clip icon or by selecting
[Y-Axis] - [Clip], the Y-axis display range of the waveform are limited to the minimum
and maximum values that were specified under [General Display Settings] - [Scale].
Measured values that are less than the minimum value are set to the minimum value and
values that are greater than the maximum value are set to the maximum value.
• ExampleinwhichDisplayLimitisEnabled
• ExampleinwhichDisplayLimitisDisabled
4.2DisplayingtheWaveform