
User guide

4-32
M-4659
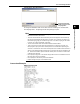
Displaying a Stacked Bar Graph of Report Data
You can display report data generated by the DX1000, DX1000N, DX2000, RD-MV1000,
or RD-MV2000 on a stacked bar graph.
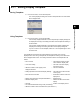
1.
Click the Open icon or choose [Open] from the [File] menu.
2.
Select a report file.
3.
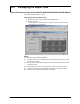
Click the [COLUMN BAR] tab.
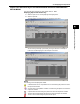
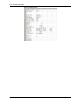
If the report data type is hourly
The example below shows a stacked bar graph of hourly reports for channels 001 to 004.
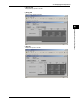
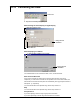
If the report data type is hourly + daily
Daily
Displays weekly for daily + weekly
Displays monthly for hourly + monthly
Hourly
Displays hourly for hourly + weekly
Displays hourly for hourly + monthly
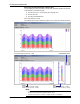
Channel display colors
Note
• The channel colors are fixed. You cannot change them.
• All channels in the report file are displayed on one screen.
• Channels containing errors, overflow, or negative values are not displayed.
4.9 Displaying the Report Files