
User guide

3-13
IM WX201-01E
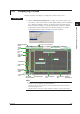
Operation of the Trend Display Window
1
2
3
4
Index
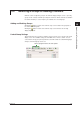
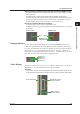
Waveform Display in Normal Format indstop and indstart MinMax Format
In Normal format, waveforms are displayed in the position corresponding to the data
value at that time.
In MinMax format, waveforms are displayed as a ll between the two points
corresponding to the Min and Max values at that time. When the Min and Max values
are the same, items are displayed as if in Normal format. If the difference between
the Min and Max values is large, the thickness of the trace increases.
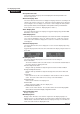
Intersection between Waveform and Cursor
In Normal format, the intersection is marked with a circle.
In MinMax format, the two intersecting points of the Min and Max values are enclosed
by an ellipse.
Circle
Normal Format MinMax Format
Ellipse
Maximum value
Minmum value
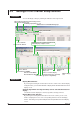
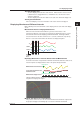
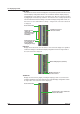
Displaying Alarms
You can show or hide the alarm display area using the Alarm ON/OFF button on the
toolbar. This operation mirrors the alarm ON/OFF operation in the Cursor Value dialog
box. Up to four alarm levels per channel are allowed. As shown in the figure below, the
alarm levels are 1, 2, 3, and 4, starting from the top level. The colors of channels on
which alarms occurred indicate the period of occurrence. If multiple alarms occur at the
same time, the alarm of the active channel is displayed in front.
Alarm level 1
Alarm level 2
Alarm level 3
Alarm level 4
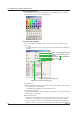
Y-Axis Display
There are six formats for the Y-axis: user zone, edit zone, full zone, slide zone, auto zone
and multi-zone. You can switch between them using the toolbar.
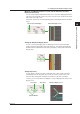
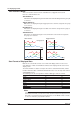
User Zone
The waveform of each channel is displayed in the position specied under Zone in the
channel display congure screen. A single Y-axis of the active waveform is displayed.
Displays the Y-axis of
the active channel
Click a Y-axis of
the active channel
Active Y-axis mark
3.4 Displaying Trends