
Manual

2-8
IM WX83-01E
2.7 Changing the Trend Graph, Extended Trend
Graph, and X-Y Graph Display Method
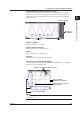
When a graph (Trend Graph, Extended Trend Graph, or X-Y Graph) is included in the
panel, the graph’s display format can be changed in the following instances (when the
graph display change toolbar is displayed).
•
When the panel display is paused (section 2.4)
• When the monitor server is disconnected (section 2.5)
The following is a description of the main display items. Items not explained herein are
the same as for the DAQ32 Plus, DAQEXPLORER, DAQLOGGER, MXLOGGER, or
GateEye. Refer to the respective user’
s manual for those items.
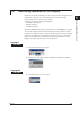
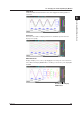
Graph Display Setting Toolbar Items
• Alarm
2
• Zoom In
2
/Zoom Out
2
• User Zone
1
/Edit Zone
1
/Full Zone
1
/Slide Zone
1
/Auto Zone
1
/Multi-Axes Zone
1
• Normal Line/Medium Line/Thick Line
• Grid density (three types)
• Clip
• Grid color/Background color/Curtain
1
/Scroll bar
1
1
Trend Graph only
2 Trend Graph and Extended Trend Graph only
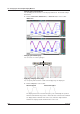
Note
The extended trend graph can display 1600 channels, but the speed of the display update may
decrease as the number of display channels increases.
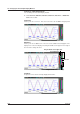
Procedure
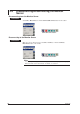
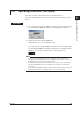
1.
Pause the panel display or disconnect the monitor server (for details, see section
2.4 or 2.5). The trend graph display icons are displayed.
Trend graph display setting toolbar
Alarm
Zoom Out
Zoom In
Edit Zone
User Zone
Slide Zone
Full Zone
Multi-Axes Zone
Auto Zone
Medium Line
Normal Line
Clip
Thick Line
Grid Density