
Manual


1-6
IM WX83-01E
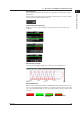
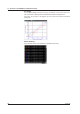
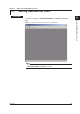
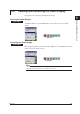
• X-Y Graph
The X-Y graph displays waveforms from up to 32 channels each on the X and Y axes.
Only the number of data specied on AddObserver Builder are displayed as
waveforms. The operation of the graph is the same as that of the trend and extended
trend graph.
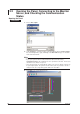
• Alarm Summary
Up to 100 past alarms ca be displayed in specied channel rang.
1.1 Overview of the AddObserver Runtime Package