User’s Manual WX83 AddObserver Runtime IM WX83-01E 7th Edition
Thank you for purchasing the AddObserver Runtime. This user’s manual contains useful information about the functions and operating procedures of this software. The AddObserver Runtime includes the software, AddObserver Panel. To ensure proper use of the instrument, please read this manual thoroughly before beginning operation. After reading the manual, keep it in a convenient location for quick reference in the event a question arises.
Software License Agreement IMPORTANT - PLEASE READ CAREFULLY BEFORE INSTALLING OR USING: THANK YOU VERY MUCH FOR SELECTING SOFTWARE OF YOKOGAWA ELECTRIC CORPORATION ("YOKOGAWA"). BY INSTALLING OR OTHERWISE USING THE SOFTWARE PRODUCT, YOU AGREE TO BE BOUND BY THE TERMS AND CONDITIONS OF THIS AGREEMENT. IF YOU DO NOT AGREE, DO NOT INSTALL NOR USE THE SOFTWARE PRODUCT AND PROMPTLY RETURN IT TO THE PLACE OF PURCHASE FOR A REFUND, IF APPLICABLE. Software License Agreement 1.
Software License Agreement 5. Infringement 5.1 If you are warned or receive a claim by a third party that the Software Product in its original form infringes any third party's patent (which is issued at the time of delivery of the Software Product), trade mark, copyright or other intellectual property rights ("Claim"), you shall promptly notify Yokogawa thereof in writing. 5.
Overview of This Manual Structure of This Manual This manual consists of three chapters and an index as shown below. Chapter 1 Title Before Using the Software 2 Monitoring with AddObserver Panel 3 Responding to Error Messages Index Description Gives an overview of the AddObserver Runtime. Also provides a list of PC system requirements and instructions for installing the software. Explains how to use a panel to monitor measured data, how to configure label displays, and how to display trend graphs.
1 Contents Software License Agreement............................................................................................................. ii Overview of This Manual.................................................................................................................. iv Chapter 1 Before Using the Software 1.1 1.2 1.3 Chapter 2 Overview of the AddObserver Runtime................................................................................
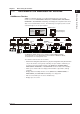
Chapter 1 1.1 Before Using the Software 1 Overview of the AddObserver Runtime AddObserver Runtime Package is a monitoring application that connects with monitor servers from YOKOGAWA’S DAQ32 Plus, DAQEXPLORER, DAQLOGGER, MXLOGGER , GateCONTROL and GateEye, and displays the acquired measurement data on user-created monitor screens. The monitoring screen (panel) can be customordered through one of our representatives.
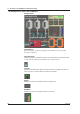
1.1 Overview of the AddObserver Runtime Package An Example of a Panel and Its Objects • Example Panel • Panel Objects A panel is made up of objects that display such information as measured data, waveforms, and alarms. • Value Rectangle Displays the value of a specified channel in a rectangle whose top and bottom sides correspond to the maximum and minimum values for that channel. • Indicator Displays the specified alarm. Blinks red during an alarm, and lights green when no alarm is occurring.
1.1 Overview of the AddObserver Runtime Package 1 • Analog Meter Displays the value of the specified channel on an analog dial. Before Using the Software 2 • Thermometer Displays the value of the specified channel on a thermometer. 3 Index • Meter Set Meter sets consist of a tag, four indicators, and a meter object. Tags display the tag name of the specified channel. Indicators display alarms 1 through 4 on the specified channel in order from left to right.
1.1 Overview of the AddObserver Runtime Package • Trend Graph Displays waveforms for the specified channels. • Picture A user-specified bitmapped image. • Button Performs one of the following functions that is assigned to the button. • Acknowledge the alarm occurrence and stop the alarm sound. • Show the monitor window that is assigned to the button. • Hide the monitor window that is assigned to the button. • Monitor Arranges the GateEye images.
1.1 Overview of the AddObserver Runtime Package • Selectable Out 1 Before Using the Software Selects strings to which numerical values are registered and sends them to the I/O Channel host. Converts values from channels corresponding to output channels to character strings registered on the builder and displays them. 2 3 • Temperature Controller Parts Displays the screens of the temperature controller parts to which controllers were assigned.
1.1 Overview of the AddObserver Runtime Package • X-Y Graph The X-Y graph displays waveforms from up to 32 channels each on the X and Y axes. Only the number of data specified on AddObserver Builder are displayed as waveforms. The operation of the graph is the same as that of the trend and extended trend graph. • Alarm Summary Up to 100 past alarms ca be displayed in specified channel rang.
1.2 PC System Requirements 2 • Operating System (OS) Run DAQWORX under any of the following operating systems.
1.2 System Requirements and Supported Monitor Servers Supported Monitor Servers AddObserver Panel can connect to the following five monitor servers. • DAQ32 Plus • DAQEXPLORER (R2.03 or later) • DAQLOGGER • MXLOGGER • GateCONTROL • GateEye Note • • 1-8 The AddObserver can connect with up to 16 monitor servers simultaneously.
1.3 1 Connecting to the Monitor Server Before Using the Software To use the functions of this software, it is necessary to connect to either the DAQ32 Plus, DAQEXPLORER, DAQLOGGER, or MXLOGGER monitor server and GateEye. Connect to the server you will be using, then proceed to chapter 2, “Using the AddObserver Panel.” 2 3 Procedure For DAQ32 Plus 1. Start DAQ32 Plus. For details, see section 2.1, “Launcher Software” in the Index DAQ32 Plus User’s Manual (IM DP320-61E). 2.
Chapter 2 Monitoring with AddObserver Panel 2.1 1 Starting AddObserver Panel Procedure 2 Monitoring with AddObserver Panel Select Start > Programs > YOKOGAWA DAQWORX > AddObserver Runtime > Panel. AddObserver Panel starts, and the Panel screen is displayed. 3 Index App1 App2 Note When installing AddObserver Panel from the AddObserver, select Start > Programs > YOKOGAWA DAQWORX > AddObserver > Panel.
2.2 Opening the Panel, Connecting to the Monitor Server, and Checking the Communication Status Opening the Panel Procedure 1. Choose File > Open. The Open dialog box is displayed. 2. In the Look in list, select the location of the desired file, then in the Files of type list select Gadget File (*.gob), and finally, in the File name box type or select the name of the desired file. Note • • • A maximum of 16 panels can be opened at the same time.
2.2 Opening the Panel, Connecting to the Monitor Server, and Checking the Communication Status 1 Connecting to the Monitor Server If you have already established a connection to the monitor server, the software automatically accesses the connection when you open a panel. Note • 2 Monitoring with AddObserver Panel • To establish a connection ahead of time, follow the instructions in section 1.4, “Connecting to the Monitor Server” before opening a panel.
2.3 Switching Label Displays You can switch a label to display the channel number, tag number, or tag comment. Procedure Select Channel No., Tag No., or Tag Comment from the View menu, or click the Channel No., Tag No., or Tag Comment buttons on the toolbar. The label displays will change accordingly. Tag Comment Tag Number Channel Number Note The View menu’s Channel No., Tag No., and Tag Comment commands are only available when a panel is open.
2.4 1 Pausing and Resuming the Panel Display Pause and resume the display update during monitoring. 2 Pausing the Panel Display Monitoring with AddObserver Panel Procedure 3 Select File > Pause, or click the Pause button on the toolbar. The panel’s display pauses. Index App1 Pause button Resuming the Panel Display App2 Procedure While the display update is paused, select File > Pause, or click the Pause button on the toolbar. The panel’s display resumes.
2.5 Disconnecting/Reconnecting the Monitor Server Disconnecting from the Monitor Server Procedure Select File > Disconnect, or click the Connect/Disconnect button on the toolbar. Connect/Disconnect button Reconnecting to the Monitor Server Procedure While the server is disconnected, select File > Connect, or click the Connect/ Disconnect button on the toolbar.
2.6 1 Restricting Operation of Out Objects Protection is enabled when the panel file specified by the user in AddObserver is opened. The user name and password are entered, and login succeeds only if there is a match. If another user is logged in, usage is restricted to the protection level of any user logging in thereafter. The panel file is restricted by the protection level of the user from login to logout, or of any subsequent user from that user’s login to logout.
2.7 Changing the Trend Graph, Extended Trend Graph, and X-Y Graph Display Method When a graph (Trend Graph, Extended Trend Graph, or X-Y Graph) is included in the panel, the graph’s display format can be changed in the following instances (when the graph display change toolbar is displayed). • When the panel display is paused (section 2.4) • When the monitor server is disconnected (section 2.5) The following is a description of the main display items.
2.7 Changing the Trend Graph Display Method 1 • Displaying Alarms You can turn alarm displays ON and OFF. 2. Click the Alarm button on the toolbar. The alarm status (tag) for each channel is displayed. However, no alarms will be displayed if the data being read has no alarm data. 2 Monitoring with AddObserver Panel 3 Index App1 Alarm status • Zooming In and Out on the Time Axis App2 You can adjust the time axis of the displayed waveform. 2.
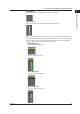
2.6 Changing the Trend Graph Display Method • Selecting a Y-Axis Display Zone You can change the waveform display method. 2. Click User Zone, Edit Zone, Full Zone, Slide Zone, Auto Zone, or Multi-Axes Zone on the toolbar. User Zone Set the y-axis as a user zone. This causes the zone to be uneditable using the panel. Edit Zone Set the y-axis as an editable zone. The zone can be edited in the trend graph’s zone display area.
2.6 Changing the Trend Graph Display Method 1 Slide Zone Unifies the widths of each waveform’s zone, then staggers the starting position of each zone. 2 Monitoring with AddObserver Panel 3 Index Auto Zone App1 Accounts for the number of displayed waveforms and divides up their waveform display areas equally. App2 Multi-Axes Zone Displays multiple y-axes (scales).
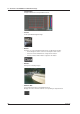
2.6 Changing the Trend Graph Display Method • Changing the Line Thickness You can change the line thickness of the displayed waveform. The default setting is Normal Line. 2. Click the Normal Line, Medium Line, or Thick Line button on the toolbar. Medium Line Thick Line • Changing the Grid Display You can select one of three grid types. Switch the grid density • Applying a Display Limit (Clip) You can specify how waveforms outside of the display range are displayed. 2.
2.6 Changing the Trend Graph Display Method 1 • Grid Color/Background Color/Curtain/Scroll Bar The grid color, background color, and curtain can be adjusted while connected to the monitor server or while the panel display is not paused. The scroll bar is only available when disconnected from the monitor server or when the panel display update is paused.
2.
2.9 1 Operating a Numeric Out Object 2 Monitoring with AddObserver Panel The numeric out object sends numerical values to the I/O Channel host. The numeric out object displays the values from the channels corresponding to output channels. 3 Procedure 1. If you click a numeric out part in AddObserver panel whose direct output property was turned OFF in AddObbserver Builder, the following dialog box appears. Index App1 2. Change the value, then click the Send button.
2.10 Operating the Selectable Out Object The selectable out object is used to select strings to which numerical values are registered and send them to the I/O Channel host. The selectable out object selects values from channels that correspond to output channels for strings registered on the builder and displays them. Procedure 1. If you click a selectable out part in AddObserver panel whose direct output property was turned OFF in AddObbserver Builder, the following dialog box appears. 2.
1 2.11 Operating Temperature Controller Parts Procedure 1. Click a component object of the temperature controller part created in 3 Index AddObserver builder. If you click a temperature controller part in AddObserver panel whose direct output property was turned OFF in AddObbserver Builder, the following dialog box appears. Enter a setting and click the Send button.
2.11 Operating Temperature Controller Parts Note • • • 2-18 If an error occurs in I/O Channel, the error is not displayed. Errors are likewise not displayed when communication with the server (I/O channel host) is broken, or if there is a problem between the server and connected instruments. If communication with the monitor server fails for some reason such as a cable becoming disconnected during transmission, the output values are not resent even if the cable is reconnected.
2.12 Playing, Stopping, and Acknowledging Alarm Sounds 2 Monitoring with AddObserver Panel You can perform the following operations on panels that have alarm sounds specified. • Stop the alarm sound (Off). • Play the sound of alarms that have not been acknowledged (On). • Acknowledge alarm sounds (ACK) 1 3 Procedure 1. Choose Alarm Sound > On (or Off) or ACK.
2.13 Closing the Panel Procedure 1. Disconnect from the monitor server. For details, see section 2.5. 2. Select File > Close, or click the Close button on the right corner of the title bar.
1 2.14 Exiting AddObserver Panel Procedure 2 1. Choose File > Exit. Monitoring with AddObserver Panel 3 Index 2. If there are no panels open that are connected to a monitor server, AddObserver Panel closes. If any panels are currently connected, a confirmation dialog box appears. Click OK to close the connection. App1 App2 Then choose File > Exit once more to exit the program.
Chapter 3 3.1 Responding to Error Messages 1 Error Messages and Their Corrective Actions The following messages may appear during operation of the software. This section describes the meanings of the messages and the appropriate corrective actions. 2 Warnings Comment COB file not found. Too many connections. Corrective Action The AddObserver can only connect with up to 16 monitor servers. Close an open panel to decrease the number of connections.
3.2 Checking the Version of the AddObserver Panel Procedure Choose Help > About. The version number and other information is displayed.
Index 1 Index A AddObserver Runtime........................................................... 1-1 alarm..................................................................................... 2-9 alarm sound......................................................................... 2-19 analog meter......................................................................... 1-3 analog meter set.................................................................... 1-3 auto zone......................................