
Instruction Manual


6-9
IM WX102-01E
1
2
3
4
5
6
7
8
9
10
11
Index
Historical Viewer Software
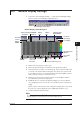
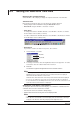
• Auto Zone
In Auto Zone the Y-axis of the waveform display area is divided into equal parts for
each selected waveform.
• Multi-Axis Zone
Displaying multiple Y-axis.
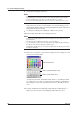
Select an axis for display as follows:
• Use the General Display Settings (See Section 6.3, General Display Settings).
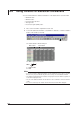
• You can drag and drop zone display bars, to and from the Y-axis display area in the
waveform display.
Zone display bars
Y-axis display area
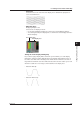
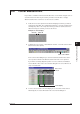
Setting the Y-axis display limiting Clip
It’s possible to apply a display limit to waveforms you view. When you set the display
limit function, waveforms will be limited between the minimum and maximum values on
the Y-Axis scale. Waveforms with data points smaller than the minimum scale value or
larger than the maximum scale value will be truncated. This function enables you to view
waveforms outside the screen range as horizontal lines in the display area.
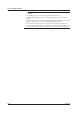
•
Waveform with clip :
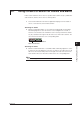
• Waveform without clip :
6.4 Setting Zones and the Y-Axis Clip