
Instruction Manual


6-5
IM WX102-01E
1
2
3
4
5
6
7
8
9
10
11
Index
Historical Viewer Software
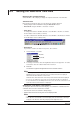
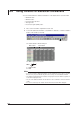
6.3 General Display Settings
1
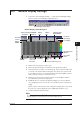
Select View > General Display Settings... , or click the General Display Settings
button to open the General Display Settings dialog box.
General Display Settings button
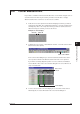
General Display setting dialog box
Paste
Copy
Select copy
items
Display
ON/OFF
Recording
channel
Display
scale
Display
zone
Setting trip point
display ON/OFF
Group tabs
Trip settings
Color display
Set all trip points
ON/OFF
Set to initial
values
Set same zone as first zone for all
Select same
scale for all
waveforms
Waveforms all
ON/OFF
Scale Math
Group Name
Setting Y-axis display ON/OFF
Linear/Log
2
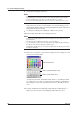
Click the tab of the group you want to open.
3
Enter a group name with up to 16 characters in the group name textbox.
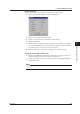
4
Select the channel you wish to record in the group. Select a channel number and
a overview of the channel numbers will appear. The channel you select here will
be recorded. If you wish to record channel display with a tag or tagID instead of a
number, make the changes on the monitor screen.
5
Click the boxes in front of the waveform numbers on the left (W01 to W32), to
select which data you want to be displayed.
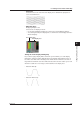
6
If Multi-Axis Zone is selected for the waveform display, you can select whether
or not to display the Y-axis. You can also choose between Linear, and Log Y-axis
display.
Click the square on the left of the Y-axis setting box to display (blue color), or hide
the Y
-axis. If you want to display the Y-axis, additionally click linear or log.
7
Set the maximum and minimum Scale.
Note
The input range is between –10
16
to 10
16
, excluding decimal points. Additional decimal points
will automatically be round off depending on the measured data and scale.