
Instruction Manual


5-5
IM WX102-01E
1
2
3
4
5
6
7
8
9
10
11
Index
Logger Software
5.3 Group Settings
1
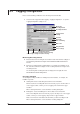
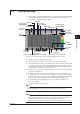
Select Logging > General Display Settings... to open the General Display Settings
dialog box. The dialog box can also be opened from each monitor screen by
selecting View > General Display Settings.
Paste
Copy
Select copy items
Display
ON/OFF
Recording
channel
Bargraph
Meter display
Thermometer
Display scale
Display zone
Setting trip point
display ON/OFF
Group tabs
Trip settings
Color display
Set all trip
points ON/OFF
Set to initial
values*
Set same zone as first zone for all
Select same
meter for all
waveforms
Set to initial
values*
Waveforms
all ON/OFF
Channel numbers appear in order from W01
Group Name
Setting Y-axis
display ON/OFF
Linear/Log
* Channels to be set to initial values can be selected by dragging number’s column.
2
Click the tab of the group you want to open.
3
Enter a group name with up to 16 characters in the group name textbox.
4
Select the channel you wish to record in the group. Select a channel number and
a overview of the channel numbers will appear. The channel you select here will
be recorded. If you wish to record channel display with a tag or tagID instead of a
number, make the changes on the monitor screen.
5
Click the boxes in front of the waveform numbers on the left, to select which data
you want to be displayed.
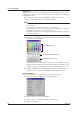
6
If Multi-Axis Zone is selected for the trend monitor, you can select whether or not
to display the Y-axis. You can also choose between Linear, and Log Y-axis display.
Click the square on the left of the Y-axis setting box to display (blue color), or hide
the Y-axis. If you want to display the Y-axis, additionally click linear or log.
7
Select the Meter type: a bargraph meter (left), ‘speedometer’ (middle), or
thermometer (right).
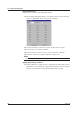
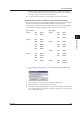
8
Set the maximum and minimum Scale.
Note
The input range is between –999999 and 999999, excluding decimal points. Additional decimal
points will automatically be round off depending on the measured data and scale.
9
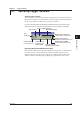
Set the waveform display area (Zone).
Note
• If the highest and lowest scale values are the same, then the highest setting will
automatically be increased with 1, and the lowest setting value will be decreased with 1.
• The lowest setting range for the Zone is 0 to 99%, the highest is 1 to 100%.
• In the waveform monitor display area, the lowest value is 0%, the highest value is 100%.