
User guide

4-13
IM WX101-01E
1
2
3
4
5
6
7
8
9
Index
Using Historical Viewer
• Slide Zone
Waveforms are displayed by vertically offsetting the position of each waveform.
Each waveform is displayed in the same zone width.
• Auto Zone
The waveform display area is equally divided according to the number of displayed
waveforms. Waveforms are displayed in each divided zone.
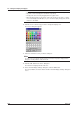
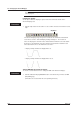
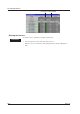
• Multiple-axis Zone
Waveforms are displayed in the zones set in the “General Display Settings” dialog
box together with multiple Y-axis scales. Setting for multiple Y-axis display is
possible in the graph viewer window as well as in the “General Display Settings”
dialog box.
T
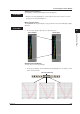
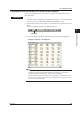
o add a Y-axis scale:
In the zone bar display area, drag the zone bar for
which you wish to display Y-axis scale and drop it in
the waveform display area.
T
o delete a Y-axis scale:
In the waveform display area, drag the Y-axis scale
you wish to delete and drop it in the zone bar display
area.
Drag & drop the scale you wish to delete.
Drag & drop the zone bar for
which you wish to display a
scale.
4.3 Changing the Viewer Window