User’s Manual WX101 DAQLOGGER WX81 DAQLOGGER Client Package IM WX101-01E 12th Edition
Thank you for purchasing the DAQLOGGER or the DAQLOGGER Client Package. This User’s Manual contains useful information about the operation of the DAQLOGGER and the DAQLOGGER Client Package. To ensure correct use, please read this manual thoroughly before operation, and keep it in a safe place for quick reference in the event a question arises. Notes • The contents of this manual are subject to change without prior notice as a result of continuing improvements to the software’s performance and functions.
Software License Agreement IMPORTANT - PLEASE READ CAREFULLY BEFORE INSTALLING OR USING: THANK YOU VERY MUCH FOR SELECTING SOFTWARE OF YOKOGAWA ELECTRIC CORPORATION ("YOKOGAWA"). BY INSTALLING OR OTHERWISE USING THE SOFTWARE PRODUCT, YOU AGREE TO BE BOUND BY THE TERMS AND CONDITIONS OF THIS AGREEMENT. IF YOU DO NOT AGREE, DO NOT INSTALL NOR USE THE SOFTWARE PRODUCT AND PROMPTLY RETURN IT TO THE PLACE OF PURCHASE FOR A REFUND, IF APPLICABLE. Software License Agreement 1.
Software License Agreement 5. Infringement 5.1 If you are warned or receive a claim by a third party that the Software Product in its original form infringes any third party's patent (which is issued at the time of delivery of the Software Product), trade mark, copyright or other intellectual property rights ("Claim"), you shall promptly notify Yokogawa thereof in writing. 5.
How to Use This Manual Structure of the Manual This User’s Manual consists of the following nine chapters and an index. Chapter 1 Title Before Operation 2 Configuring the System 3 Monitoring the Data 4 Displaying the Waveform on the Viewer 5 File Utility 6 Event Processor 7 8 Configuring the Recorder Using the DAQLOGGER Client Package Error Messages and Corrective Actions 9 Index Description Gives an overview of the DAQLOGGER and the DAQLOGGER Client Package.
Conventions Used in This Manual Unit K Denotes 1024. M Denotes 1024K. G Denotes 1024M. Example: 100 KB Example: 10 MB Example: 2 GB Symbols used in operational explanation In the pages explaining operation (chapter 1 to 8), the following symbols are used to distinguish the descriptions. Procedure IM WX101-01E Note This subsection contains the operating procedure used to carry out the function described in the current section.
Contents Software License Agreement............................................................................................................. ii How to Use This Manual................................................................................................................... iv Conventions Used in This Manual.....................................................................................................v Chapter 1 Before Operation 1.1 1.2 Chapter 2 Configuring the DAQLOGGER 2.1 2.2 2.3 2.
Contents 5.5 5.6 Chapter 6 Event Processor 6.1 6.2 6.3 6.4 Chapter 7 Starting the Hardware Configurator...................................................................................... 7-1 Loading the Setting Parameters........................................................................................... 7-4 Editing the Setting Parameters............................................................................................. 7-5 Setting VR Series...........................................
Chapter 1 1.1 Before Operation 1 DAQLOGGER DAQLOGGER is a software application used to acquire measured or computed data from a recording device (hereinafter, recorder) connected to a PC that has DAQLOGGER installed or multiple recorders connected to other PCs. The maximum number of channels that can be managed is 1600.
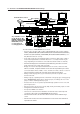
1.1 Overview of the DAQLOGGER/DAQLOGGER Client Package DAQLOGGER RS-232/RS-422A converter DAQLOGGER client Data transmission Data acquisition RS-232 Ethernet Data acquisition RS-422A Data acquisition RS-232 VIEW RECORDER VR200 Any combination of 32 of MXLOGGER 1 PC. the µR, VR, DX, CX, MV, DARWIN, DAQEXPLORER, DAQ32Plus, DAQLOGGER, HUB MXLOGGER, and Gate recorders/PC-based recording applications.
1.1 Overview of the DAQLOGGER/DAQLOGGER Client Package 1 Software Construction of DAQLOGGER DAQLOGGER consists of the following 14 software applications. This program is started first and manages the startup of other DAQLOGGER software applications. It also manages multiple projects. • A project refers to the set of DAQLOGGER settings that corresponds to each user or purpose. It contains the settings of all software applications that are described below.
1.1 Overview of the DAQLOGGER/DAQLOGGER Client Package • Data Monitor Data Monitor is started from Software Manager. This application can display the data that have been scanned by the Logging Software and the alarm conditions on the following five types of monitor screens. Each monitor displays tags that have been assigned to the recorder’s channels using Tag Editor by groups that have been assigned using Group Editor.
1.1 Overview of the DAQLOGGER/DAQLOGGER Client Package 1 2 • Software Configurator Software Configurator is started from Software Manager. Software Configurator is used to assign recorder numbers of DAQLOGGER to the recorders that are connected. It is also used to set the configurations of the recorders and communication parameters. DAQLOGGER scans and records the data based on the information specified here. The settings are as follows: • Type of communication (RS-232, RS-422, and Ethernet).
1.1 Overview of the DAQLOGGER/DAQLOGGER Client Package • The original SET mode and SETUP mode information can be • Loaded from the recorder via communications (receive via communications). • Loaded from a file that is stored on a storage medium such as a floppy disk (this is called “file importing”). • Created from scratch. • The settings after they are edited can be • Written to the recorder via communications (transmit via communications).
1.1 Overview of the DAQLOGGER/DAQLOGGER Client Package 1 Before Operation The following items can be specified. • Type of report (hourly, daily, weekly, or monthly), the tags to be reported, and the type of data to be created. • Data to be used to make the report (scan data or record data). • Output destination of the report (file or print) and the output file format (binary or text). • The date or day and time of report generation. In addition, report files (binary) can be displayed on Viewer.
1.1 Overview of the DAQLOGGER/DAQLOGGER Client Package • Control Server The Control Server is started from the Manager software. Using a PC connected via ** Ethernet (remote controller ), you can start a scan, start/stop recording, and start/stop the event processor. For the operating procedure of the Control Server, see section 2.13. ** Remote Controller The DAQLOGGER client package is required for the remote controller. For an overview of the package’s functions, see “DAQLOGGER Client Package” below.
1.1 Overview of the DAQLOGGER/DAQLOGGER Client Package The data display is updated according to the interval (frequency of data retrieval) that is specified by the conditions for connection. Displays the waveform of the retrieved data for each group. You can change the display conditions such as zooming in or out of the time axis and specifying the Y-axis zone to be displayed. • Numeric monitor Before Operation • Trend monitor 1 2 3 Displays the numerical values of the retrieved data for each group.
1.2 PC System Requirements and Recorders That Can Be Connected PC System (for DAQLOGGER) OS Run DAQWORX under any of the following operating systems.
1.2 PC System Requirements and Recorders That Can Be Connected 1 Printer (used when printing) Printer and printer driver supported by the OS Before Operation Communication converter (necessary for RS-422 communication) 2 RS-232/RS-422 converter Recorder • µR recorder 3 µR1000 or µR1800 with communication option (RS-422, /C3). µR12000 cannot be used (GateµR required to use the µR10000/µR20000).
1.2 PC System Requirements and Recorders That Can Be Connected PC System (for DAQLOGGER Client Package) OS: Same as for DAQLOGGER. PC: Same as for DAQLOGGER. Hard disk Free disk space: 200 MB or more CD-ROM Drive (for Use during Installation) Mouse: Same as for DAQLOGGER. Monitor: Same as for DAQLOGGER. Communication port: Ethernet port supported by the OS. Printer (used when printing): Same as for DAQLOGGER. Note Data created in 2035 or later cannot be handled.
Chapter 2 2.1 Configuring the DAQLOGGER 1 The Workflow of the Configuration The workflow of the configuration is shown below. Prepare the recorder Section 2.2 Section 2.3 Set a project Section 2.4 • Create a new project • Select an existing project • Delete an existing project Set the security Section 2.5 • Set operation level to a project • Set password protection • Set desktop protection Set communications and the connected Section 2.
2.2 Preparing the Recorder Before starting DAQLOGGER, set recorder’s communication parameters then connect the recorder to the PC. For µR1000/µR1800/VR100/VR200 Settings for RS-422 communication Provide the following settings. • Baud rate: 9600 bps • Data length: 8 bits • Parity: None • Stop bit: 1 bit • Address: Set a unique address to each recorder. See the Communication Function Manual of the recorder (IM 4D5B1-10E, IM 4H3B110E, or IM 4N1A1-11E).
2.3 1 Starting DAQLOGGER Starting DAQLOGGER 2 Procedure From the Start menu, select “Programs” - “YOKOGAWA DAQWORX” “DAQLOGGER” - ” Manager.” Software Manager starts and the “DAQLOGGER Manager” window appears. In the window, there are 13 buttons used to start the individual applications (functions). Start scanning Start recording Stop scanning/recording Start the Data Monitor Start Viewer Configuring the DAQLOGGER 1.
2.3 Starting DAQLOGGER Note • • • Use the recorder disconnect function such as when replacing the chart paper of the recorder. Do not change the input range of channels after disconnecting the recorder. If you change the input range of a channel, the channel is processed as if it is turned OFF when the recorder is reconnected. The recorders that have been disconnected using the above procedure cannot be automatically reconnected. For details on the auto reconnect function, see section 2.9.
2.4 1 Setting a Project Note The operations described in the following are possible only when all DAQLOGGER applications other than Software Manager are terminated and the password protection is not used. Creating a New Project To create a new project, the operation level of the current project must be “Supervisor.” Procedure 1. 2. Before operation, make sure that DAQLOGGER is not communicating, applications other than Software Manager are not running, and the password protection is not used.
2.4 Setting a Project 4. Input a project name and select an operation level; then click “OK.” For more details about the operation level, see “Setting Operation Level to a Project” in section 2.5. Note • • • 5. You cannot use the following characters in a project name: \ / : , ; * ? ” < > |. The following character combinations cannot be used as project names.
2.4 Setting a Project 1 Copying Project You can copy project settings from one project to another. Procedure 1. 2. 2 Same as the operation in “Creating a New Project.” Same as the operation in “Copying a New Project.” Configuring the DAQLOGGER 3 4 5 3. Select the project you want to copy settings to in the Project list. Only select a project whose operation level is Supervisor. Click Copy. The Copy Project dialog box appears. 4. 6 7 8 9 Index 5.
2.5 Setting the Security To prevent mis operation, you can set an operation level to each project. In addition to this operation level, DAQLOGGER’s security function offers password protection and desktop protection. Setting Operation Level to a Project For individual projects, you can set an operation level selecting from “Supervisor,” “Operator,” and “User.” Under these operation levels, operation will be limited as follows.
2.5 Setting the Security 1 Setting Password Protection Password protection is a function to limit operation as shown below, regardless of the project’s operation level. Protection OFF Follows project’s operation level. Follows project’s operation level. Follows project’s operation level. Follows project’s operation level. Follows project’s operation level. Follows project’s operation level. Follows project’s operation level. Follows project’s operation level. Follows project’s operation level.
2.5 Setting the Security 3. Type the password in the “New Password” and “Confirm” boxes then click “OK.” Note • • A password must be within 16 characters. Any character is acceptable. Do not forget the password you set. Canceling the use of password function This operation does not clear the password already set. The password will take effect if you specify its use again. Procedure 1. In the menu bar of the “DAQLOGGER Manager” window, select “File” then “Project Setting.
2.5 Setting the Security Setting the password protection ON With a project for which the use of password function is specified, this operation turns the password protection ON. This operation is disabled while Hardware Configurator, Tag Editor, or Software Configurator is running. Procedure In the menu bar of the “DAQLOGGER Manager” window, select “File” then “Password Protection.” The password protection is turned ON.
2.5 Setting the Security Setting Desktop Protection Desktop protection is a function that temporarily hides the start menu bar and icons (shortcuts) of Windows normally displayed on the screen. When desktop protection is ON, other software cannot be started, so the personal computer is protected from careless operations. Setting the desktop protection ON Procedure 1. In the menu bar of the “DAQLOGGER Manager” window, select “File” then “Desktop Protection.” The “Hide Desktop” dialog box appears.
2.6 1 Setting Communications and the Connected Recorder Setting the Environment When Communicating Directly with the Recorder 3 4 Setting serial communications (only for serial communications) Set the serial interface port. The data length is fixed to 8 bits. Procedure 1.
2.6 Setting Communications and the Connected Recorder 2. Click the “Serial Setting” tab. The Serial Setting panel appears. Turns ON/OFF the Copies the settings of the first port number in the ports in the selected selected range to the settings of all the port numbers range at once. in the selected range. 3. 4. Click the check box in the “Port No.” cell to set the port to be used.
2.6 Setting Communications and the Connected Recorder Setting the Connected Recorder Before you start this setting operation, obtain information about the recorders that are connected: model, channels, options, communication address, etc. If you are connecting to the recorder using the serial port, serial communication setting must be completed in advance (see the previous section). From the “Recorder Setting” panel, assign the communication port and address to each of the connected recorders. 1.
2.6 Setting Communications and the Connected Recorder • For Ethernet The following dialog box appears. Set the items manually. IP address or host name Enter IP address or the host name of the recorder (up to 255 alphanumeric characters). Login name Enter the login name (User name) set on the DX, MV, or CX (up to 20 alphanumeric characters). User ID Enter the User ID set on the DX (up to 20 alphanumeric characters).
2.6 Setting Communications and the Connected Recorder 3. Recorder Model Determination button 1 2 Configuring the DAQLOGGER Select the “No.” cells. Then, press the “Recorder Model Determination” button or select “Recorder Model Determination” from the “Communication” menu. The “Recorder Model Determination” button is enabled when you select “No.” cells of recorders whose “Port” and “Address” has been entered.
2.6 Setting Communications and the Connected Recorder 4. After you have read the communication messages, click “OK.” The Recorder Settings screen shows the model names, measurement channels, and other information that have been automatically detected. 5. Confirm that the model information that was displayed through automatic detection matches the model information of the recorder that is actually connected. If it is not correct, reset the items according to the following procedure.
2.6 Setting Communications and the Connected Recorder • Entering the settings manually Note For a description of the settings for DAQEXPLORER, DAQ32Plus, DAQLOGGER, MXLOGGER, and Gate, see “Setting the Environment When Communicating with a PC with Software Applications Installed” (page 2-22). C. If necessary, click the “Math Ch.” cell and select the correct computation channel from the list box. The number of channels displayed in the list box varies depending on the model.
2.6 Setting Communications and the Connected Recorder D. If necessary, click the “Ctrl. Ch” cell. The dialog box below appears. The “Ctrl. Ch” cell is only available for CX models. E. If necessary, set the “Extra. Ch” cell. The “Extra. Ch” cell is only available for DX2000 and MV2000 models with the /MC option.
2.6 Setting Communications and the Connected Recorder 1 Switching “Standalone” and “Expandable” under the “Recorder Setting” tab (see page 2-13) By clicking the tool cell at the bottom of the “Recorder Setting” tab, you can switch between “Standalone” and “Expandable” for the selected DA100, DR200, and DC100 recorders. If you switch between “Standalone” and “Expandable,” procedure B, “Initialize” below is executed. The number of measurement channels can also be selected by clicking the “Math Ch.
2.6 Setting Communications and the Connected Recorder Setting the modules Click the position where the module is to be attached. The module selection dialog box opens. If you clear the check mark by clicking “Delete,” the modules that can be attached become selectable. Select the module with the option button. For clamp input terminals, select the “Clamp” check box. To delete a module, clear the check mark by clicking “Delete.
2.6 Setting Communications and the Connected Recorder Click “OK” to activate the new settings and close the subunit selection dialog box. Click “Revert” to set the settings back to the settings that existed when the subunit selection dialog box was opened. Click “Cancel” to discard the settings and close the subunit selection dialog box.
2.6 Setting Communications and the Connected Recorder Monitor server Set the port number and system number of the monitor server only when multiple software applications are installed in the target PC and multiple monitor servers are running. If you perform recorder model determination without specifying the port number or the system number, the system with the smallest system number is searched. Note • • 3.
2.6 Setting Communications and the Connected Recorder • When connecting to a Gate series instrument, the recorder model determination function displays the models whose system numbers are set to 01. To display models with system number 02 or higher, specify the number in the System field. When setting the system numbers, start from 0 for the number of the Gate series setting screen and continue with 1, 2, and so on.
2.7 Setting Tags Name the channels of the recorders which have been set using the Software Configurator. The Data Monitor and Historical Viewer use these names (tag names) to handle the collected data. Basic Operation To select tag • Click the number cell (Tag No.). • To select a series of numbers from more than one tag, click the first cell then, pressing the SHIFT key, click the last cell.
2.7 Setting Tags 2. Auto Assignment button 1 2 Configuring the DAQLOGGER Click the “Auto Assignment” button or, in the menu bar, select “Edit” then “Auto Assignment.” The recorder and channel numbers are assigned automatically according to the instrument settings entered in the Software configurator. Tag numbers are assigned starting with Tag No.
2.7 Setting Tags C. If necessary, click the “Channel” cell and select the channel that is to be assigned to the tag from the list box. The list box lists the channel numbers of the measurement channels, computation channels, Int. Loop channels, Ext. Loop channels, and Extra channels which were set using the Software Configurator. Clicking the tool cell in the bottom sets the channel numbers for the tags in the selected area.
2.7 Setting Tags • A maximum of 1600 lines of data is imported (the 1601st and subsequent lines are invalid). 1 Example: [TAB] = tab, [CR/LF] = carriage return/line feed, [SP] = space. Tag Name When Importing 123456789 123456789 Deletes the tab name of the corresponding line. Deletes the tab name of the corresponding line. 123456789 Spaces at the end of the string are invalid.
2.7 Setting Tags Searching Tags You can search tags by specifying the tag name, tag number, or recorder number. If a tag is selected, the search begins from the selected tag. Procedure 1. Click “Search” on the toolbar or select “Search” from the “Edit” menu of the “DAQLOGGER Tag Editor” window. The “Move/Find” dialog box opens. 2. 3. 4. 5. 2-30 Click “Tag Name,” “Tag Number,” or “Recorder No.” Enter the item to be searched in the entry box of the selected item.
2.7 Setting Tags 1 Moving the Display by the Specified Number of Tags You can move the display by the specified number of tags. Procedure 1. 2 Configuring the DAQLOGGER Click “Search” on the toolbar or select “Search” from the “Edit” menu of the “DAQLOGGER Tag Editor” window. The “Move/Find” dialog box opens. 3 2. 3. 4. 4 Enter the number of tags to move for each operation in the width box. Click “Up” or “Down” to move by the specified number of tags. Only the display moves.
2.8 Setting Groups Assigns the tags set by Tag Editor to groups. Up to 32 tags can be assigned to a single group, and up to 50 groups can be specified. In addition, names can be placed on the groups. Data Monitor and Viewer display the scanned and recorded data by groups that are specified here. Basic Operation To select the waveform number (W**) • Click the appropriate number cell. • To select tags consecutively, click the first cell, and then, pressing the SHIFT key, click the last cell. • Click “No.
2.8 Setting Groups Waveform number Auto Grouping button Group selection tab Group list (Group number and group name) 1 2 Configuring the DAQLOGGER 3 4 5 6 Turn ON/OFF the Starting with the first tag in the selected Click this button to show or selected range at once range, tags are assigned to the selected hide the group list section. range in the order that is specified by the Tag Editor. 3.
2.8 Setting Groups To manually assign the tags to groups or to change the assignment, perform the following procedure. 4. 5. Click the tab to select the group to assign the tags. Click the “Tag No.,” “Tag Name,” or “Model: Channel” cell of the waveform number to assign the tag. A dialog box for selecting “Tag No.,” “Tag Name,” or “Model: Channel” appears. Select the “Tag No.,” “Tag Name,” or “Model: Channel” to be assigned. Select “None,” if the tag is not to be assigned. Changing any one of “Tag No.
2.8 Setting Groups 1 Saving the Group Settings Group settings cannot be saved while scanning or recording is in progress. Procedure 1. 2 In the “DAQLOGGER Group Editor” window, select “Save” from the “File” menu. The settings are saved. The group setting items are items that can also be set or changed in the display settings of Data Monitor. If you change the tag assignments, show/hide condition of tags, or group names and save the information, the information is also reflected in Data Monitor.
2.8 Setting Groups 5. Click “OK” to display the print preview dialog box. The print image of the selected group is displayed. 6. Click “Close” in the print preview dialog box to close the print preview display. Printing the Group Setting Information 7. 8. 9. In the “DAQLOGGER Group Editor” dialog box, choose “Print” from the “File” menu or click the “Print” icon on the tool bar.
2.8 Setting Groups 1 Terminating the Group Editor If there are group settings that have not been saved, a save confirmation message appears. Save the settings according to the message. 2 Procedure In the “DAQLOGGER Group Editor” window, select “Exit” from the “File” menu. The “DAQLOGGER Group Editor” window closes and the program terminates. Configuring the DAQLOGGER 1.
2.9 Configuring the Logger Before collecting measured/computed data by executing SCAN and RECORD, set the logger configuration. Configuring the Logger Procedure 1. In the menu bar of the “DAQLOGGER Manager” window, select “Logger” then “Configuration.” The “Logger Configuration” dialog box appears. 2. In the “Scan Interval” box, enter the scan interval in seconds.
2.9 Configuring the Logger 4. 5. 6. 7. 8. 1 2 Configuring the DAQLOGGER If necessary, set whether or not to measure in zero start adjustment mode. In zero start adjustment mode, when the scan interval is less than a minute (1 to 59), the start time of the scanning operation is adjusted so that the operation takes place at 00 sec every minute.
2.9 Configuring the Logger 10. If necessary, specify the name of the data file in the “Extra file name” box. The specified character string will be placed at the beginning of the file name. For example, if “ABCD” is specified, the file names will be ABCD-0000.mld, ABCD-0001. mld, etc. If it is not specified, the file names will be 000.mld, 0001.mld, etc. The file extension “.mld” is fixed. 11. If necessary, check the “Add Date” box.
2.9 Configuring the Logger Note • • When becoming a communication fault, the data of the recorder is displayed to OFF. The following occur in the Monitor and Viewer screens during communication retries. Monitor screen If the communication retry is successful, the channel settings of the connected instrument with which communication was recovered are reloaded, and waveforms are redisplayed.
2.9 Configuring the Logger Starting the Scanning In the scanning operation, data is being collected from the connected recorders via communication and the personal computer receives the data, but does not save it. Procedure 1. In the “DAQLOGGER Manager” window, click the “SCAN” button. After obtaining the information of each recorder, the scanning operation starts. Note The time it takes to start the scanning operation depends on the number of connected recorders.
2.9 Configuring the Logger 1 Displaying the Information of the Scanned and Recorded Data Procedure 1. In the “DAQLOGGER Manager” window, select “Logger Information” from the “Logger” menu. As shown below, the information about the data being scanned and recorded is displayed.
2.10 Configuring the Report Function The Report Function prints (or outputs to a file) at a specified time, the instantaneous values, the minimum and maximum values from the data that are scanned and recorded over an hour, a day, or a month and, in addition, the average values, sums, and accumulating totals that are determined by computation. The file is output in binary or text format. You can view the binary files using Viewer.
2.10 Configuring the Report Function 1 Sum and accumulating total • Sum This value is computed by summing the data over an hour for hourly reports, over a day for daily reports, over a week for weekly reports, and over a month for monthly reports. It is reset at the time when the corresponding report is generated. Accumulating total can be specified only on hourly and daily reports.
2.10 Configuring the Report Function Processing for abnormal data If any abnormality is detected in the data being computed, the following processing will be performed according to the type of computation and the type of data abnormality.
2.10 Configuring the Report Function 1 Setting the Contents of Hourly/Daily/Weekly/Monthly Reports Procedure 1. In the menu bar of the “DAQLOGGER Manager” window, select “Others,” “Report,” and then “Configuration.” The “DAQLOGGER Report” dialog box appears. Click to open the “Group Selection” window. 2 Configuring the DAQLOGGER The tags initially displayed in the report settings window are those of the current project's saved data.
2.10 Configuring the Report Function Check box Green: A portion of the tags within the group is selected for the report Blue: All tags within the group are selected for the report Gray: None of the tags within the group is selected for the report (Window when the “Max” box is clicked) Switch the group name/group Specify/Cancel the report item for the groups in the selected range at once. number display.
2.10 Configuring the Report Function 4. 5. The first line: Type, “REPORT,” date of generation, and start time of data scanning or recording 1 2 Configuring the DAQLOGGER Specify the input source. Select “Scan” or “Record.” Scan : Use the data per scan interval. Record : Use the data per record interval. Specify the output destination. Binary: Outputs the report to a file in binary format (extension: .rbi). The report can be viewed using Viewer.
2.10 Configuring the Report Function 6. Specify the base time and date. This is the date and time the reports are created. Specify the time for hourly reports, date and time for monthly reports, and day and time for weekly reports. The time is common to all reports (hourly, daily, weekly, and monthly reports).
2.10 Configuring the Report Function 1 Report Function You can print out the report settings. Procedure 1. 2. 3 Terminating the Report Configuration Procedure 1. 2 Configuring the DAQLOGGER In the DAQLOGGER Manager window, choose Other > Report > Print Setting. Enter the settings, then press OK. The report settings are printed out. The report pages for time, day, month, and week must be printed out separately. In the “DAQLOGGER Report” dialog box, click “OK” at the bottom of the window.
2.11 Setting Up the DDE Server Using the DDE server permits data and time that are scanned and recorded by the logging software to be loaded into client applications, such as EXCEL. For detailed information about DDE, refer to a book that is commercially sold. Starting the DDE Server Procedure 1. Click “DDE” in the “DAQLOGGER Manager” window. The DDE Server starts and the “DAQLOGGER DDE” window appears.
2.11 Setting Up the DDE Server 1 The “Update Mode” dialog box opens. 2 Configuring the DAQLOGGER 3 Select either of the following and click “OK.” “Scan Interval” is default. Scan Interval Updates data of individual items at the scan interval set in the logging software. However, the data are updated only during the scanning operation. Record Interval Updates data of individual items at the record interval set in the logging software.
2.11 Setting Up the DDE Server Preparing the DDE Client DDE Server uses the following character strings (application name, topic name, and item name) to provide DDE services so that DDE clients can read the data. Application name Topic name MLDdeSrvr sdate (Changeable) data Item name date (Date) time (Time) no (Data No.) TAG001 (Scanned or recorded data) ................. ................. .................
1 2.12 Setting Up the Monitor Server 3 Starting the Monitor Server Procedure 1. 2 Configuring the DAQLOGGER The Monitor Server transfers the scanned or recorded data to the remote monitor* that is connected via the Ethernet network. Up to 16 remote monitors can be connected. The remote monitor can be used to display and monitor the received data. Click “M.SERV” in the “DAQLOGGER Manager” window. The Monitor Server starts and the “DAQLOGGER Monitor Server” window appears.
2.12 Setting Up the Monitor Server Pausing/Terminating the Monitor Server Procedure 1. To pause or resume the Monitor Server, perform the following procedure. In the “DAQLOGGER Monitor Server” window, select “Pause” from the “Monitor Server” menu. The data updating on the remote monitor side is paused. To resume the Monitor Server, select “Monitor Server” and then “Resume” in the menu bar of the “DAQLOGGER Monitor Server” window. The data updating on the remote monitor side is resumed. 2.
1 2.13 Setting Up the Control Server Entering Control Server Settings 2 Configuring the DAQLOGGER The control server forwards each control request that is sent from the remote control software (see chapter 8) to the manager software. Procedure 1. 3 Press the C.SERV button in the DAQLOGGER Manager window. 4 Starts the control server When using the DAQLOGGER for the first time after installation, the Login Password window is displayed.
2.13 Setting Up the Control Server Scan Stop: Received scan stop command. Record Stop: Received record stop command. Event Processor Start: Received Event Processor start command. Event Processor Stop: Received Event Processor stop command. User Event: User event sent. Choose Control Server > Port No., and enter the port number to which the remote control software will connect. Be sure not to enter settings that overlap with other applications. 2. 3. 4. 5.
Chapter 3 3.1 Using Data Monitor Displaying Waveforms on the Monitor Window Data Monitor, the monitor software, displays the measured/computed data that is currently being collected using the logger software. Data monitor offers 5 display formats to display measured data: trend, numeric, meter, alarm, and color graph. 2 3 Displaying the Monitor Using Data Monitor Procedure 1. 1 In the “DAQLOGGER Manager” window, click the “MONITOR” button. The “DAQLOGGER Data Monitor” window appears.
3.1 Displaying Waveforms on the Monitor Window Note • • • You can open multiple monitor windows at the same time, but doing so may lower the PC’s performance. When multiple monitor windows are displayed, the windows can be aligned. In the menu bar, select “Window” then “Cascade” or “Tile.” Up to two alarm monitor screens can be displayed. Up to twelve screens of other monitors can be displayed.
3.
3.1 Displaying Waveforms on the Monitor Window Color Graph Monitor Waveform display color Link ON/OFF button Tag number/name display switch button Auto Grouping Zoom in/out of time axis Display settings Cursor value display button Pause waveform display Save display settings Select monitor Red bar start blinking when an alarm occurs Select display group Tag number/name Time (absolute time) or elapsed time (relative time) The color of the graph changes with data value along the scale.
3.2 1 Setting the Display Conditions In this section, set the display conditions common to all types of monitors, such as scale, zone, and waveform color. Also set the meter type for the meter monitor. 2 Note In the following descriptions, “Tag Name” will be used to identify tags. If you wish to display and use “Tag Number” instead, click the tag number display button in the tool bar. 3 To select waveform number(s) • Click the waveform number (“No.” cell).
3.2 Setting the Display Conditions Automatically Assigning Tags to Groups The scanned data are displayed by groups. You can specify the number of tags per group (up to 32 tags/group), and automatically assign tags up to 50 groups. Procedure 1. From the “View” menu, select “Auto Grouping.” The “Automatic Group Setting” dialog box opens. 2. 3. 4. Enter the number of tags to assign per group in the “Amount of tags/group” box. If necessary, select the “Use current display settings” check box.
3.2 Setting the Display Conditions 1 Setting the Display Conditions for Individual Groups Waveforms are displayed on a group-by-group basis. A group can contain up to 12 tags, and the maximum of 32 groups can be registered. Procedure 1.
3.2 Setting the Display Conditions 5. 6. 7. Set the ON/OFF of the waveform display. To display waveform in the graph, click the check box in the “No.” cell to turn it ON (blue). Set Y-axis display conditions. Specify the ON/OFF of the Y-axis display when a multiple-axis zone is selected. Also specify the scale of Y-axis (linear or logarithmic). Select the type of meter display in the “Meter Type” cell from bar meter, analog meter, and thermometer.
3.2 Setting the Display Conditions 1 Note • • • • The trip points can be set within the range of scale values specified for each tag. Trip points 1 and 2 are displayed in red and blue, respectively. When the trend monitor is stopped, the trip points can be moved by dragging them on the trend monitor. When the display position of a trip point is entered, the check box in the “Trip 1” and “Trip 2” cells are automatically turned ON (blue).
3.3 Changing the Display Settings of Monitor Windows The display settings of monitor windows can be changed as desired. This section describes the display settings of monitor windows: trend monitor, alarm monitor, and color graph monitor windows.
3.3 Changing the Display Settings of Monitor Windows 1 Trend Monitor Changing the time axis The time axis notation can be changed between absolute and relative time. For both notations, the current zoom factor is shown on the right side of the time axis. With the absolute time notation, the date is displayed on the left side. 2 Procedure 1. Absolute time 3 Using Data Monitor From the menu bar, select “TimeAxis” then “Absolute Time” or “Relative Time.” • Absolute time: Displays the time of the day.
3.3 Changing the Display Settings of Monitor Windows • User Zone Waveforms are displayed in the zones set in the “Display Settings” dialog box. Zones settings cannot be changed in the trend monitor window, but can be changed in the “Display Settings” dialog box. For details about settings in the “Display Settings” dialog box, see section 3.2 “Setting the Display Conditions” (P.3-5). • Edit Zone Waveforms are displayed in the zones set in the “Display Settings” dialog box.
3.3 Changing the Display Settings of Monitor Windows • Multiple-axis Zone Waveforms are displayed in the zones set in the “Display Settings” dialog box together with multiple Y-axis scales. The operation to display multiple Y-axis scales described in the following is possible when the trend monitor’s display updating is paused. Drag & drop the Y-axis scale you wish to delete.
3.3 Changing the Display Settings of Monitor Windows Limiting the display Set the style in which to display the portion of the waveform that extends off the waveform display area. Procedure 1. Click the “Clip” button on the toolbar or, from the menu bar, select “Y-Axis” then “Clip.” Clip button The waveform display range along Y-axis is limited to the minimum and maximum scale values set in the “Display Settings” dialog box.
3.3 Changing the Display Settings of Monitor Windows 1 Specifying the waveform line width Procedure 1. In the menu bar, click “View” then select “Thin Line,” “Medium Line,” or “Thick Line.” 2 Adjusting the brightness The brightness of the grid and background can be adjusted. Procedure 1. Moving the trip points The trip points can be moved when the monitor is paused. Turning ON/OFF the trip point display is only possible from the “Display Settings” dialog box. Procedure 1. 2.
3.3 Changing the Display Settings of Monitor Windows Displaying alarm indication Alarm conditions are displayed in the bottom of the waveform display area of the trend monitor window. If an alarm occurs, a horizontal bar, which increases in size according to the time period of the alarm duration, is displayed in the color of the waveform that is causing the alarm. Alarm indicator bars are displayed for level-1, level-2, level-3, and level-4 alarms from top to bottom.
3.3 Changing the Display Settings of Monitor Windows Note • • The blinking ring displayed around the alarm lamp indicates that there are unconfirmed alarms (Alarm Hold state). To confirm the unconfirmed alarms, click the lamp of the group with a blinking ring. The ring will disappear. To cancel the Alarm Hold state of all the tags at a time, select “View” then “Hold Reset” from the menu bar.
3.
3.4 1 Using the Cursors Displaying the Cursors and Reading the Values at the Cursors Cursor operation is possible while the monitor’s display updating is paused. 2 3 Using Data Monitor On the trend monitor and color graph monitor, and color graph monitor the measured data values at the position specified with the cursor can be displayed. On the alarm monitor, the measured data values at the start and end points of the area specified in the alarm log display can be displayed.
3.4 Using the Cursors The “Cursor’s Value” dialog box appears showing the date and time of measurement and the measured values at the cursor positions. To precisely adjust the cursor position, click the “cursor adjustment” button on the right of the data number. The cursor moves by one data point at each click. If the monitor window is used for operation, the results of the operation are reflected to the “Cursor’s Value” dialog box; and vice-versa.
3.4 Using the Cursors 3. In the “Log” tab panel (alarm log display) of the alarm monitor, drag the mouse from one line to another. The cursor’s values at the start and end points of the selected area are displayed in the “Cursor’s Value” dialog box. 1 2 3 Using Data Monitor 4 Values at the start and end points of the selected area are displayed. 5 6 7 Clearing the Cursors To clear the cursors, perform the operation shown below.
3.5 Saving the Monitor Window Snapshot Function Saves the active monitor window to an image file (PNG format). Procedure 1. 2. Choose “Snapshot” from the “File” menu. A dialog box appears for you to specify the output file name. Specify the file name and click “OK.” The image file of the active monitor window is saved when the menu command is selected. The extension is .png. Note To view the image saved to PNG format, an application program that supports image files in PNG format is required.
3.6 1 Pausing and Terminating the Monitor Pausing the Monitor This operation pauses the display updating of the monitor. The measured data is collected even when the display updating is paused. Therefore, when the display updating is resumed, the data measured while the monitor was paused will be displayed. Procedure Click the “Pause” button on the toolbar or, from the menu bar, select “Monitor” then “Pause.” The display updating of the monitor stops. Monitor pause button 3 Using Data Monitor 1.
Chapter 4 4.1 Using Historical Viewer 1 Displaying Waveforms on the Viewer Window Historical Viewer, the viewer software, displays the measured data collected using the logger software in forms of waveform and numerical value. It also displays the data created using the report function. The viewer can display the data in the following data files. • Data files storing the data collected or being recorded using the logger software (file extension: .
4.1 Displaying Waveforms on the Viewer Window Opening a saved data file Procedure 1. Click the “Open” button on the toolbar or select “File” then “Open” from the menu bar. The “Open” dialog box appears. 2. Select the folder and the type of data file (*.mld) you wish to open. File names are listed in the dialog box. Note • • 3. Multiple data files can be opened at a time. The number of files that can be opened at a time depends on the memory size and free disk space of the personal computer.
4.1 Displaying Waveforms on the Viewer Window 1 Graph Viewer Set limit on waveform display (set clip).
4.1 Displaying Waveforms on the Viewer Window Data Overview When the graph is displayed, pulling down the overview bar displays the data overview. The data overview displays the loaded data values in color. When the data value exceeds the maximum scale, the color is red. When the data value is less than the minimum scale, the color is blue. The colors in between change from red to yellow to green to light blue to blue. The waveforms in the section enclosed in the white frame are displayed.
4.1 Displaying Waveforms on the Viewer Window 1 Displaying the binary report file data Data in a binary report file is displayed in a sheet. Procedure 1. 2 Carry out the step 1 operation in “Opening a saved data file” (P.4-2) to open the “Open” dialog box. 3 4 Using Historical Viewer 5 6 7 8 2. 3. 9 Select the file type of binary report file (file extension: .rbi) to list the file names. Select the file you wish to open from the file list, then click the “Open” button.
4.1 Displaying Waveforms on the Viewer Window Viewing information about the loaded data file Information about the loaded data file (data file of the active viewer window) can be viewed. Procedure 1. From the menu bar, select “Information” then select “About Document.” The “File Information” dialog box appears. 2. In this dialog box, you can enter or edit the header that will be used when printing the data. Type the print title into the entry box. Up to 32 characters can be entered.
4.2 1 Setting the Display Conditions In this section, we will explain how to set the display conditions of the viewer such as scale, zone, and waveform color for each tag that was set using the Tag Editor. 2 Note In the following descriptions, “Tag Number” will be used to identify tags. If you wish to display and use “Tag Name” instead, select “View” from the menu bar then select “Tag Name.
4.2 Setting the Display Conditions Setting the Display Conditions for Individual Groups Data is displayed on a group-by-group basis. A group can contain up to 32 tags, and a maximum of 50 groups can be registered. Operation of the “General Display Settings” dialog box is the same as that of the Data Monitor’s “Display Settings” dialog box, except that the former dialog box has no meter type setting and has a “Scale Calc” button. Procedure 1.
4.2 Setting the Display Conditions 1 2 3 4 5 This dialog box shows the tag numbers of the tags that are set using the Tag Editor. • Click the new tag name you wish to assign. • If you do not wish to assign a tag, click the “None” at the bottom. After the “Tag Name” dialog box is closed, the new settings will appear in the “General Display Settings” dialog box. 5. 6. 7. Using Historical Viewer Note Set the ON/OFF of the waveform display. Click the check boxes in the “No.
4.2 Setting the Display Conditions Note • • • • The trip points can be set within the range of scale values specified for each tag. Trip points 1 and 2 are displayed in red and blue, respectively. The trip points can be moved by dragging them to the graph viewer. When the display position of a trip point is entered, the check box in the “Trip 1” or “Trip 2” cells is automatically turned ON (blue). If you do not wish to display the trip point, click the check box to turn it OFF. 10.
4.3 1 Changing the Viewer Window The display of the viewer window can be changed as desired. This section describes how the display on the graph viewer can be changed. 2 The graph viewer window is similar to the trend monitor window, except that the graph viewer has a zone bar display area in the left part of the window and the line width of the waveform cannot be changed. 3 Changing the time axis The measured/computed data copied to the clipboard have the time notation as set here. Procedure 1.
4.3 Changing the Viewer Window Selecting the Y-axis waveform display zone The waveform display format can be changed by selecting the zone type. Procedure 1. Click one of the “Zone” buttons on the toolbar or select the zone type form the dropdown list of “Y-Axis” in the menu bar. Full Zone Edit Zone Slide Zone Multiple-axis Zone User Zone Auto Zone • User Zone Waveforms are displayed in the zones set in the “General Display Settings” dialog box. The zones cannot be changed in the viewer window.
4.3 Changing the Viewer Window • Slide Zone Waveforms are displayed by vertically offsetting the position of each waveform. Each waveform is displayed in the same zone width. 1 2 • Auto Zone The waveform display area is equally divided according to the number of displayed waveforms. Waveforms are displayed in each divided zone.
4.3 Changing the Viewer Window Note Displayed trip points and grid are those for the Y-axis scale displayed in the most right of the Y-axis display area. Limiting the display Set the style in which to display the portion of the waveform that extends off the waveform display area. Procedure 1. Click the “Clip” button on the toolbar or select “Y-Axis” from the menu bar then select “Clip.
4.3 Changing the Viewer Window 1 Adjusting the brightness The brightness of the grid and background can be adjusted. Procedure 1. Drag the corresponding brightness control slider located on the left of the zone bar display area to change the brightness. Moving the trip points Turning ON/OFF the trip point display is only possible from the “General Display Settings” dialog box. 2 3 Procedure 1. 4 As necessary, drag the trip point to the desired position.
4.3 Changing the Viewer Window Displaying alarm indication The conditions of the measured data alarms set in the recorder can be displayed in the viewer window. Procedure 1. Click the “Alarm” button on the toolbar or select “View” from the menu bar then select “Alarm.” The alarm conditions of the waveform data in the active viewer window are displayed in the graph viewer and sheet viewer windows and the “Control” dialog box.
4.4 1 Using the Cursors On the graph viewer, the measured data values at the position specified with the cursor can be displayed. There are two types of cursors, cursor A and cursor B. The measured data values at cursors A and B and the results of statistical computations between the two cursor points can be displayed. 2 3 Displaying the Cursors and Reading the Values at the Cursors Procedure 1.
4.4 Using the Cursors The cursors can be shifted by pressing one of these buttons Clearing the Cursors To clear the cursors, perform the operation shown below. Procedure 1. 4-18 From the menu bar, select “View” then “Erase Cursor.” When the cursors are cleared, no data is displayed in the “Control” dialog box’s table.
4.4 Using the Cursors 1 Copying Measured Data between the Cursors to the Clipboard The measured data between the cursors can be copied to the clipboard and used in other applications. 2 Procedure 1. Select the area (1000 data points at maximum) on the graph or sheet viewer window you wish to copy to the clipboard by dragging and dropping the cursor. Click the “Copy” button on the toolbar or select “Edit” from the menu bar then select “Copy.” The measured data is copied to the Windows clipboard. 2.
4.4 Using the Cursors Displaying the Results of Statistical Computation The statistics are calculated over the data between cursors A and B, and the results are displayed. The statistics have the following 5 types of values: minimum, maximum, P-P, mean, and RMS. Procedure 1. In the graph or sheet viewer window, select the interval over which the statistics will be computed by dragging and dropping the cursor.
4.5 1 Using Marks Marks can be placed on the time axis at the positions specified with the cursor. The marks are displayed above the waveform on the graph viewer, and to the left on the sheet viewer. By default (reset condition), the following marks are placed. TRIG: Data at the time the recording operation was started (first data point of the file) by the logging software.
4.5 Using Marks Resetting the Mark Display The reset condition is a condition in which only the “TRIG” or “BOUNDARY” marks are placed. Procedure 1. 4-22 From the menu bar, select “Edit” then select “Reset Mark.” All the marks are cleared.
4.6 Searching Measured/Computed Data, Alarms, and Marks You can set conditions and search for measured/computed data, alarms, and marks. 1 2 Searching Measured/Computed Data, Alarms, and Marks Procedure 1. 2. In the graph viewer or sheet viewer, select the range to be searched using cursors. From the “Edit” menu, select “Search.” You can also click “Search Settings” on the toolbar. The “Search” dialog box opens.
4.6 Searching Measured/Computed Data, Alarms, and Marks Searching Measured/Computed Data 5. Select the groups to be searched. Click the group name button to display the “Select Group” dialog box. Then, select the group. Click “ALL” to select all groups. 6. Select the tags to be searched. Click the tag button to display the “Tag Number” or “Tag Name” dialog box. Tags that are contained in the groups that were selected in step 5 are displayed. Select the tags.
4.6 Searching Measured/Computed Data, Alarms, and Marks 7. 8. Select the alarm type. Click the cell and select the alarm type from the list box. Alarm All: Search all alarms. Alarm 1, Alarm 2, Alarm 3, or Alarm 4: Search for the specified Alarm No. (alarm level). Set the alarm condition to be searched. Click the cell and select the alarm condition from the list box. Changed: Data position where the alarm changed from ON to OFF or OFF to ON. Start: Data position where the alarm ON condition started.
4.6 Searching Measured/Computed Data, Alarms, and Marks 10. Specify the cursor to be displayed at the data position that matched the search conditions. Specify Cursor A, Cursor B, or Cursor A and B. 11. Click “Run” to execute the search, and the cursor is displayed at the data position that matched the search conditions. The search result (group number, waveform number, and data number) is displayed at the bottom section of the dialog box.
4.7 1 Converting Data Formats The measured data and report data can be converted to ASCII, Lotus 1-2-3, and MSExcel data formats. The file extensions for the data files in each format are as follows. • ASCII: .txt • Lotus 1-2-3: .wrk • MS-Excel: .xls 2 3 Procedure 1. 4 Using Historical Viewer 2. From the “Convert” menu, select “To ASCII,” “To Lotus,” or “To Excel.” The dialog box for the selected data conversion appears.
4.7 Converting Data Formats 5. 6. Select the folder and file type, and type the file name. Click the “OK” button. The measured data is converted to the selected format and saved in a file. File Format of the Converted Measured Data The file format for Lotus 1-2-3, MS-Excel, and ASCII are shown below.
4.7 Converting Data Formats 1 Title 1 2 3 4 5 6 7 8 9 10 11 12 13 " D A Q L O G G E R ( 14 R 21 22 23 24 25 26 27 28 29 30 31 32 33 S o f t w a r e I 34 D 15 16 17 18 19 20 X . X X ) 35 36 37 38 39 40 1 2 3 - 4 5 2 3 41 42 43 44 45 46 6 7 " CR LF 8 4 RX.XX is the software version number. The software is the license number.
4.
4.7 Converting Data Formats 1 Tag name 1 2 3 4 " T a g 21 22 23 24 5 25 6 7 8 9 10 11 N a m e " , 26 27 28 29 . 12 13 14 15 16 17 18 19 20 Tag name . . . . . 2 . . . ? ? CR LF The length of a tag name is fixed to 18 characters, including the double quotation marks that enclose each tag name. For tag names shorter than 16 characters, blanks are appended. Tag names cannot be longer than 16 characters.
4.7 Converting Data Formats Time of data collection and measured data For absolute time 1 2 3 4 5 6 7 8 9 10 11 " Y Y Y Y - M M - D D 21 22 23 24 25 26 27 28 29 30 31 . S " , 41 42 43 44 12 32 13 14 15 16 17 18 19 20 H H : m m : S S 33 34 35 36 37 38 39 40 , Measured value Measured value ? ? , . . . . . . . . . . . . . . CR LF 5 6 7 8 9 10 11 12 13 14 15 16 17 18 19 20 H H : m m : S S .
4.7 Converting Data Formats 1 File Format of the Converted Report Data The file format for Lotus 1-2-3, MS-Excel, and ASCII are shown below. 2 Lotus 1-2-3 File Format MS-Excel File Format Converting ASCII data to this format allows the data to be displayed in cells. ASCII File Format 3 A text file delimited with tabs.
4.8 Exporting Data You can cut out (copy) a section of a data file and save the result. This operation does not change the original data. Procedure 1. 2. Select the range of data to be cut out using the cursors. From the “Convert” menu, select “Export.” The “Export” dialog box appears. 3. 4. The range that was selected by the cursors are indicated in the “Start” and “End” boxes using data numbers. To change the data range to be exported, enter values in the appropriate boxes.
4.9 1 Printing Data The measured data and report data displayed in the viewer can be output to a printer connected to a personal computer. 2 Setting the Printer The printer is set with the same operation as the Windows Print command. 3 Procedure 1. From the menu bar, select “File” then select “Printer Setup.” The “Print Setup” dialog box appears. Set the print items in the dialog box and click “OK.” 2. 4 Set the printer in accordance with your system environment.
4.9 Printing Data Printing Procedure 1. 2. Click the “Print” button on the toolbar or select “File” from the menu bar then select “Print.” Specify the print range and other items. Set the “Range” and “Color” of the graph viewer by clicking the radio buttons. Also type a title if desired. Set the “Range” of the sheet viewer or the report data. To thin the printout, specify the number of data to advance to before the next print (Print Step).
1 4.10 Linking and Displaying Data Files File Link and Display Function The file link display function is used to virtually display the data files that are continuous in time as if they were a single data file. With this function, sets of data files that have been scanned and recorded to divided files can be displayed and handled as if they were of a single file on the Viewer.
4.10 Linking and Displaying Data Files 3. When the name of the file you wish to link is selected, a “Select Process” dialog box may appear. Select either process, and click “Select” to perform the link. Note • • The “Select Process” dialog box appears when adding the selected file causes the number of displayed data points to be 8 KB or more and the load size to be 10 MB or more. For details, see “Opening a saved data file” in section 4.1.
4.10 Linking and Displaying Data Files 1 Displaying a List of Linked Files You can display a list of linked files and check the link condition of the current file. Procedure 1. Select “List Linked Files” from the “Window” menu. The “List of Linked Files” dialog box appears. 2 3 4 Using Historical Viewer The displayed information consists of “File,” “Start,” and “End.” The list is displayed in order from the oldest start time.
4.11 Saving the Display Conditions/Terminating the Historical Viewer When the Historical Viewer is terminated, the display conditions at the time of termination can be saved. The next time the software is started, the condition data is loaded and the display conditions are restored. You can also save the display conditions by selecting “File” then “Save Display Setting.” When multiple data files are linked and displayed using the File Link Display Function of section 4.
4.11 Saving the Display Conditions/Terminating the Historical Viewer 1 Terminating the Historical Viewer When terminating the Viewer, if the display conditions have been changed, a dialog appears for you to specify whether or not to save the changes. Click “Yes” or “No” as necessary. 2 Procedure 1. From the menu bar, select “File” then select “Exit” or click the close button in the upper right corner of the window. The Historical Viewer terminates.
Chapter 5 5.1 File Utility 1 Starting the File Utility The File Utility performs the following four functions on the data file or report file that the DAQLOGGER creates. Merge: Merges the files that are continuous in time to a single file. Divide: Divides a single file into several files. Convert: Converts the data to Excel, ASCII, and Lotus1-2-3 formats. Restruct.: Merges the files once and then divide the file using new conditions. The extensions for the applicable files are indicated below.
5.2 Merging Measurement Data Files Merges multiple files that match the following conditions and creates a single file. The extension of the output file is .mld. • Data files that have been saved through file division by enabling the file division mode (Data Count, Per Day, Per Hour, or Per Month) during data scanning and recording. • Data files that have been divided through the Division Point mode of the File Utility (excludes fixed time mode).
5.2 Merging Measurement Data Files 1 Procedure 1. Click the “Merge” tab. The Merge Setting page appears. 2 3 4 5 Displays the approximate progress of the process. Enter the files to be merged under “Input.” The input type list box is fixed to “Directory.” 2. Click “Select” and specify the directory containing the files to be merged in the dialog box that appears. 3. Files that can be merged into a single file are arranged and displayed. Click the possible file group tab. 4.
5.2 Merging Measurement Data Files Specifying the output file Specify the output file name and save destination under “Output.” 5. The output type list box is fixed to “File.” 6. Click “Select.” In the dialog box that appears, select the directory in which the output data is to be saved and enter the file name. Note • • • 7. Do not specify an external storage medium such as a floppy disk for the save destination of the output file, because saving to such medium takes a long time.
5.3 1 Dividing Measurement Data Files Divides a file and creates multiple files. The output file names are automatically created. The extension is .mld. There are three division types: Division Point, Interval Length, and Single Fixed. Division Point Divides the source file in units of one day or one hour. When dividing the file in units of one day, you can divide the data at certain hours of the day. 2 3 4 Interval Length Divides the source file into files of a specified length.
5.3 Dividing Measurement Data Files 2. Enter the source files to be divided under “Input.” Select “File” or “Directory” in the input type list box. Note If “Directory” is specified, all the files in the selected directory that match the conditions are divided. 3. 4. Click “Select” and specify the files or directory in the dialog box that appears. Specify the directory in which to save the output file under “Output.” The output type list box is fixed to “Directory.
5.3 Dividing Measurement Data Files 1 When set to “Interval Length” 5. From the “Type” drop-down list, choose “Interval Length.” 2 3 4 5 File Utility 6 7 • When specifying the length in terms of the number of data points 6. 7. 8. Under “Interval Type,” click the “Data Count” option button. Enter the number of data points in the text box. Click “OK” to execute the divide operation. Click “Abort” to abort the operation. 8 • When specifying the length in terms of time 6. 7. 8.
5.3 Dividing Measurement Data Files When set to “Single Fixed” 5. From the “Type” drop-down list, choose “Single Fixed.” • When specifying the position in terms of the data number 6. 7. 8. 9. Under “Position Setting,” click the “Data No.” option button. Enter the first data number of the extracted position in the “Start Data No.” text box. From the list box, select “End Data No.
5.4 1 Converting the Data Format Converts data files or report files with .rbi extension to Excel, ASCII, or Lotus1-2-3 formats. 2 Procedure 1. Click the “Convert” tab. The Convert page appears. 3 4 5 File Utility 6 7 8 Specifying the files to be data-converted 9 Specify the file to be converted or a directory containing the files under “Input.” 2. Select “File” or “Directory” in the input type list box.
5.4 Converting the Data Format Specifying the output file or directory Specify the file or directory in which to save the output file under “Output.” 4. In the output type list box, select “File” if the input is set to “File,” “Directory” if input is set to “Directory.” Note If you set output to directory when input is set to file or if you set output to file when input is set to directory, the input setting is automatically changed. 5.
5.5 1 Restructuring Measurement Data Files This function carries out the “Merge” and “Divide” functions at once. The file is restructured by merging the files once and dividing the merged file again using new conditions. Files with .mld extension are applicable. The output file name is automatically created based on the name of the first file that is to be merged. The extension is .mld.
5.5 Restructuring Measurement Data Files Specifying the output file Specify the output file name and save destination under “Output.” The output type list box is fixed to “Directory.” 5. Click “Select.” Specify the directory in which to save the output file in the dialog box that appears. Note • • • Do not specify an external storage medium such as a floppy disk for the save destination of the output file, because saving to such medium takes a long period.
5.6 1 Exiting the File Utility You can exit from the File Utility through the following methods. • Select “Exit” from the “File Utility” menu. • Select “Close” from the system menu. • Double-click the File Utility icon on the system menu. • Click the “Close” button at the upper right corner of the “File Utility” dialog box. 2 3 Note You cannot exit from the File Utility while data is being written to a file.
Chapter 6 6.1 Event Processor 1 Setting Events In the Event Processor function, transmission to an FTP server, e-mail transmission, or file conversion is performed on the target file when the specified conditions of alarm, time, and system status are met. For example, the following process can be performed. • Transmit the contents of the alarm information in an e-mail message when an alarm occurs. • Transfer the data file to an FTP server when a data file is created.
6.1 Setting Events Setting Events Procedure Starting event settings 1. In the menu bar of the “DAQLOGGER Manager” window, choose Others > Event Processor > Configuration. The DAQLOGGER Event Processor dialog box appears. Note When the event processor is in execution, you cannot change the event settings. Creating new events 2. Click “New.” The “Event Page” appears. 3. 4. Enter the name of the event in the “Event Name” box. Set “Display Tag” to “Tag Name” or “Tag Number.
6.1 Setting Events 1 Setting event conditions 5. Click the “Conditions” tab to display the “Event Condition Page.” 2 3 4 5 6 7. 8. 9. Even if a specified event condition is matched, the event only occurs if you enable the function by selecting the Continue check box. • When selected: Continue judging conditions even after first match. • When cleared: Discontinue after matching the condition once.
6.1 Setting Events Select Group dialog box Click the desired group to close the dialog box and apply the selected group. Select Tag dialog box Click the desired tag to close the dialog box and apply the selected tag. • When set to Time The condition is met when the time of the data being scanned exceeds the specified time. The condition is determined only when scanning is in progress. Select a time interval of Minutely, Hourly, Daily, Weekly, Monthly, and Interval. The reference day is 0.
6.1 Setting Events • When set to System The condition is met when the specified system status occurs. The following system statuses are detected. Data File Created: When the creation of a data file is completed. If the division mode is not specified, this status does not occur until the recording is completed. Report File Created: When the creation of a report file is completed. The report type does not matter. Recorder Disconnected: When a recorder disconnect is detected.
6.1 Setting Events Setting the target file 10. Click the “Target File” tab to display the “Target File Page.” 11. Select the target file from “Data File,” “Report File,” “PNG File,” and “User File” in the “File Type” list box. • When set to Data File The newest created data file is the target file. • When set to Report File The newest created report file is the target file. Report files are binary files. Specify the type of report file.
6.1 Setting Events • When set to PNG File When the event condition is met, the active window of the Monitor is saved to a PNG file. Valid only when “Output File” is set to “Specify File.” Click “Select” to display the “Select File” dialog box. 1 2 3 4 5 You can directly enter the string in the text box. This is valid only when "Select File" is selected. Specify the output file name.
6.1 Setting Events • When set to User File Creates a text file using the information of the items specified below. Also, records the communication disconnect/recovery status for connection destinations to which communication failed the first time. Specify the output of time information. Specify the delimiter for items in the file. If the check box is selected, spaces are used to delimit the items in the file. If the check box is cleared, tabs are used to delimit the items. Specify the output file name.
6.1 Setting Events 1 Example of User File 2 3 4 5 6 Specifying the execution process Event Processor 12. Click the “Process” tab to display the “Process Page.” 7 8 9 Index Changing the order of and copying processes (see page 6-15) None (extension only): Change only the extension per a preexisting name-rule. Add Event No. and Process No.: Add the event number Enn and process number Pnn to the file name. The format appears as follows: [File name_EnnPnn]. You can also change the extension.
6.1 Setting Events 13. Select from None (Extension Only) to Suffix is Event No. and Process No. in the Rule of Auto Name box. 14. Click a number in the “No.” column to select the process number. 15. Select “FTP,” “E-Mail,” “Convert” and “Format” from the “Process” list box. • When set to FTP Bookmark: Select, edit, or register the FTP server to be accessed. Click “Add/Select” to display the “Add/Select Bookmark” dialog box. Server: Specify the FTP server address. This parameter is always entered.
6.1 Setting Events 1 • When set to E-Mail 2 3 4 SMTP: Specify the SMTP server. This parameter is always entered. Click “Edit” to display the “SMTP” dialog box. 5 Subject: Enter the subject of the e-mail message. Enter the e-mail address of the transmitter. Click “Select” to display the “Select Address” dialog box. To: Enter the e-mail address of the receiver. Click “Select” to display the “Select Address” dialog box. Cc: Enter the e-mail address for the “carbon copy.
6.1 Setting Events Selection SMTP dialog box Enter the SMTP server address using a string. Enter the port number using a value. OK: Save and close the dialog box. Apply the server name to the E-Mail dialog box. Cancel: Clear the edited information and close the dialog box. Select Address dialog box Enter an arbitrary string for identifying the user. Enter the e-mail address. Applies the address of the selected number to the E-Mail dialog box. Save: Save the information and close the dialog box.
6.1 Setting Events 1 • When set to Convert Select the file to be converted. The files that can be converted are data files (.mld) and report files (.rbi). Select “None,” “Target File,” or “Select File.” • Selecting “Target File” specifies the file that was specified in the “Target File” page. • Selecting “Select File” allows you to specify the file name. Enter the file name directly in the text box or click “Select” to select the file from the “Select File” dialog box.
6.1 Setting Events • When set to Format Select how the file to be formatted will be specified from Auto Name or Specify File. When set to Auto Name, the extension of the input file name changes per the format type. For detailed settings, see PNG File. Select the file to format. Lets you specify the text file selected on the Target File page (user file, data file, or report file). • Select this only when None or User File is selected for the target file on the Target File page.
6.1 Setting Events Changing the Order of and Copying Process 16. In the table on the left side of the execution process page, click the number of the process that you wish to change the order of. 1 2 3 4 “ ”: Sets the process settings of the selected number as the copy source. Testing the execution process 18. In the table on the left side of the execution process page, press the button in the “Test” column corresponding to the process you wish to test. 19. If “Target File” or “Prev.
6.1 Setting Events 21. Click “OK.” The result (success or fail) is displayed on the button in the Test column. Note If the following message appears when you click a button in the “Test” column, the execution process setting is not correct. Click “OK” and set the execution process again. Example The following is an example for setting the event, “convert the data file to a text file when the data file is created.” Procedure 1. 2. 3. 4. 5. 6. 7. 8. 9.
6.1 Setting Events 1 10. Click the “Target File” tab to display the “Target File Page.” 11. Select “Data File” from the “File Type” list box. 2 3 4 5 Click the “Process” tab to display the “Process Page.” Click a number in the “No.” column to select the process number. Select “Convert” from the “Process” list box. Select “Text” from the “Convert To” list box. Select “Target File” from the “Input File” list box. Select “Auto Name” or “Select File” from the “Output File” list box.
6.2 Saving, Deleting, Redisplaying, or Copying Events Saving Events Saves the settings for each event. Procedure 1. 2. Click “Save” in the DAQLOGGER Event Processor dialog box. If there are no problems in the settings, the event is saved. If there is a problem in the settings, a message dialog box appears. Click “OK.” The page with the problem is displayed. Set the parameters again. Deleting Events Deletes the setting of an event. Procedure 1. 2.
6.2 Saving, Deleting, Redisplaying, or Copying Events 1 Copying Events Copies setting parameters between events. Procedure 1. 2. 3. 4. 5. 2 Click the event name tab and select the copy source event page. Click “Copy” in the DAQLOGGER Event Processor dialog box. Click the event name tab and select the copy destination event page. Click “Paste” in the DAQLOGGER Event Processor dialog box. A dialog box containing a confirmation message appears. Click “OK.
6.3 Starting/Stopping the Event Processor Starting the Event Processor Starts the execution of the event that was specified in the event setting. Procedure 1. From the menu bar of the “DAQLOGGER Event Processor” dialog box, choose Others > Event Processor > Start. An error dialog box appears if there are no specified events. Stopping the Event Processor Stops the execution of the event. Procedure 1.
6.4 1 Displaying Error Information Even if an error occurs during event execution, the Event Processor does not display a dialog box containing an error message and does not abort the operation. The error information dialog box only displays the information of the newest error that occurred. In addition, the error information can be initialized. 2 3 Procedure 1. From the menu bar of the “DAQLOGGER Event Processor” dialog box, choose Others > Event Processor > Display Error Information.
Chapter 7 7.1 Setting the Recorder 1 Starting the Hardware Configurator The Hardware Configurator can be used to create setup parameters for the SET mode (setting mode) and the SETUP mode (basic setting mode) of the recorder and write the setup parameters back to the recorder to configure the recorder. If the recorder is already configured, you do not have to configure the recorder using this software program.
7.1 Starting the Hardware Configurator when “Setting” windows are displayed “Setting” window The following operations can be carried out using the Hardware Configurator. • Read setup parameters from the recorder via communications For the operating procedure, see section 7.2. For limitations on each model, see “Hardware Configurator” in section 1.1. • Write setup parameters to the recorder via communications For the operating procedure, see section 7.11.
7.1 Starting the Hardware Configurator 1 Showing/Hiding “Recorder List” window Procedure 1. Select “Recorder List” from the “View” menu. The window is shown or hidden every time the menu command is selected. 2 Arranging the “Setting” windows Procedure 1. 3 With the “Setting” window showing, select “Cascade” or “Tile” from the “Window” menu. The “Setting” windows are arranged accordingly. 4 Showing/Hiding the toolbar or status bar Procedure 1. Select the item to show or hide from the “View” menu.
7.2 Loading the Setting Parameters Load the setting parameters from the connected recorder. Procedure 1. In the menu bar, select “Communication” then “Receive.” The “Select Recorders” dialog box opens. 2. Select the recorders from which to receive data, then click the “Receive” button. • To select all the recorders Click “Select All.” • To select individual recorders In the list, currently connected recorders are shown in blue.
7.3 1 Editing the Setting Parameters Selecting the Recorder 2 Procedure 1. In the “Recorder List” window, click the “No.” cell of the recorder for which you wish to change settings. The settings window of the selected recorder appears on top. 3 4 5 6 7 2. From here, recorder settings operations follow. The operations are classified into eight types as shown below by the series of recorders.
7.3 Editing the Setting Parameters Basic Setting Operation The operations in tab panels are summarized as the following two types. Recorder-to-recorder copy and channel-to-channel copy are convenient editor functions. Operation in Channel tab panels • Operations in the tab panels for channel settings, which are titled with “Channel,” “Meas,” or “Math.” However, the title may differ between each series.
7.3 Editing the Setting Parameters Channel-to-channel copy You can copy the settings between channels by using the “Copy” button in the Channel tab panel. Procedure 1. 1 2 Click the “CH” cell of the source channel, then press the “Copy” button. 3 4 “Copy” button • For DARWIN The “Selection of Copy Item” dialog box opens. Select the items to be copied and click “Close.” The content of the “Selection of Copy Item” dialog box varies depending on the recorder. Click “All Items” to select all items.
7.3 Editing the Setting Parameters • µR, VR, DX, MV, CX Proceed to step 2. 2. Press the “Copy Details” button. The “Copy Details” dialog box opens. The setting items contained in this dialog box differ for each series of recorders. 3. 4. 5. After selecting the items to be copied, click “OK.” Select the “CH” cell of the channel to copy to (you can select more than one channel). To select channels over a series of numbers, click the first cell then, pressing the SHIFT key, click the last cell.
7.4 1 Setting VR Series Changing any of the system configurations, will result in initialization of Hardware Configurator settings. Therefore, perform system configuration before making any other settings. 2 Editing the Settings Open the setting window of VR100, VR200, or VR200 S2 and click the appropriate tab or select the setup item from the menu. Unavailable items appear dimmed (you cannot enter values for them). For details on each setup item, see the respective recorder manual.
7.4 Setting VR Series • Range Measurement range. • Scaling Specify whether or not to use the function that converts the measured values into other units for display. • Square root computation Specify whether or not to use square root computation. • Span The upper and lower limits of the display. • Scale The upper and lower limits of the display of scaling, square root computation, or computation channel. • Decimal position The decimal position of scaling or the scale of the computation channel.
7.4 Setting VR Series “Channel Setting” dialog box This dialog box is designed to facilitate the input operation of the “Channel” tab panel. It appears when you double-click the “CH” cell in the “Channel” tab panel. 1 2 3 4 5 6 7 8 “Misc.” tab panel From this panel, set items regarding LCD, data file, trip level, wave span rate, and messages. The display contents are switched by selecting an item listed in the left part of this panel.
7.4 Setting VR Series • Trip Level Set the trip point. This figure shows the “Trip Level” setting dialog box for VR200 S2. Click to open the “Select Color” dialog box (for VR200 S2 only) • Waveform Span Rate This is the rate at which the displayed waveform is updated. For VR200 S2 only • Message (for VR200 S2 only) Up to 16 characters Copy and paste messages Sets whether or not to display the menu that executes the message display on the setup menu of the operation mode.
7.4 Setting VR Series 1 • Daylight Saving Time Set the “Summer Time” and “Winter Time.” 2 3 4 “SETUP” tab panel From this panel, set items regarding alarm function, input processing, display, data storage method, remote control, TLOG computation, communication, selection of channel or tag display, message display language, memory end time, password, and temperature unit. The display contents are switched by selecting an item listed in the left part of this panel.
7.4 Setting VR Series • Display Click to open the “Select Color” dialog box • AUX Switches channel display and tag display, selects the language used to display messages, sets the remaining time of the memory when the memory end alarm is to be generated, sets the password, and selects the temperature unit. Number (4 digits or less) The initial value is “0” • Data Storage Method The format used to write measured/computed data to memory.
7.4 Setting VR Series 1 • Remote Control (for VR200 S2 only) Assigns a function to the input terminal of the remote control. 2 3 4 • Communication (only for models with the communication function) 5 6 7 If necessary, change the system configuration such as the presence or absence of options to match the VR that is to be configured. Changing the system configuration initializes the settings of the SET mode and SETUP mode. Perform changes in the system configuration first.
7.5 Setting µR Series Changing any of the system configurations, will result in initialization of Hardware Configurator settings. Therefore, perform system configuration before making any other settings. Editing the Settings Below are the settings windows for µR1000 and µR1800. The items which cannot be set are displayed in gray and you cannot input to them. For details of each setting item, see the manual of the recorder. The display examples in the following are those for µR1800.
7.5 Setting µR Series 1 • Range Measurement range. • Scaling 2 Specify whether or not to use the function that converts the measured values into other units for display. 3 • Square root computation Specify whether or not to use square root computation. • Span 4 The upper and lower limits of the display. • Scale The upper and lower limits of the display of scaling, square root computation, or computation channel.
7.5 Setting µR Series “Channel Setting” dialog box This dialog box is designed to facilitate the input operation of the “Channel” tab panel. It appears when you double-click the “CH” cell in the “Channel” tab panel. Pressing the “Operator” button shows the dialog box to select operators when “Mode” is set to “MATH” “Misc.” tab panel From this panel, set the chart speed, dotting period, and message. The display contents are switched by selecting an item listed in the left part of this panel.
7.5 Setting µR Series 1 Message 2 Up to 16 characters 3 Daylight Saving Time 4 Set the “Summer Time” and “Winter Time.” 5 6 Changing µR system configuration Procedure 1. Open the setting window of the µR of which the system configuration is to be changed, and select “System Configuration” from the “System” menu of the “DAQLOGGER Hardware Configurator” window. The “System Configuration” dialog box opens. 2. 3. IM WX101-01E Set the model, options, etc. to match the µR.
7.6 Setting DX100, DX200, MV100, MV200 Changing any of the system configurations, will result in initialization of Hardware Configurator settings. Therefore, perform system configuration before making any other settings. Editing the Settings Below are the settings windows for DX100, DX200, DX200C, MV100, and MV200. The items which cannot be set are displayed in gray and you cannot input to them. For details of each setting item, see the appropriate DX/MV series manual.
7.6 Setting DX100, DX200, MV100, MV200 Setting the Measurement Channels Double-clicking the “CH” cell in this panel opens the “Channel Setting” dialog box (see page 7-24) for input. You can input from either the panel or the dialog box.
7.6 Setting DX100, DX200, MV100, MV200 Input Type (Mode and Range/Type) Select from the list of choices from the pull-down menu.
7.6 Setting DX100, DX200, MV100, MV200 Alarm value Alarm is generated using the specified value as the boundary. The selectable range of alarm values vary depending on the input mode and range. Alarm delay Alarm is generated when the measured value stays above or below the specified alarm value for the specified time (delay period). 1 2 3 Relay To output relays, select the output relay number. Otherwise, select [NONE].
7.6 Setting DX100, DX200, MV100, MV200 Partial Expanded Display Position (%) Set the boundary for the partial expanded display. The range is from 1 to 99%.
7.6 Setting DX100, DX200, MV100, MV200 1 Setting the Computation Channels Double-clicking the “CH” cell in this panel opens a dialog box for input. You can input from either the panel or the dialog box.
7.6 Setting DX100, DX200, MV100, MV200 Alarm and Tag The settings are the same as the measurement channels. For details, see section 8.2, “Setting the Measurement Channel.” TLOG Computation Timer Select one of the timers (1 to 3) set in the setup mode. The computation interval of TLOG computation is set to the time assigned to the selected timer. Sum scale Set the sum scale. Rolling Average Interval Select the sampling interval when rolling average is activated.
7.6 Setting DX100, DX200, MV100, MV200 Setting One Computation Channel at a Time 3. Select the tab of the item to be configured. Click here to enter the operator 1 2 1. Double-click the channel you wish to set. 3 2. The channel setting dialog box opens. 4 5 6 4. After setting the items, click here. Set the maximum value. Set the minimum value. Setting the Recorder Copy the first setting.
7.6 Setting DX100, DX200, MV100, MV200 Screen Display Select the time per 1 division Select this tab Select the display format of the trend and bar graph The screen saver function is activated, when there is no key operation or alarm occurrence for the specified time period. Recover by a key operation or alarm occurrence Recover by a key operation If you selected MV100 in the “System Configuration” dialog box, “User key” on the “Setting” page will not be displayed.
7.6 Setting DX100, DX200, MV100, MV200 1 Circular display setting (DX200C Only) Normal trend display Circular display 2 Set the time corresponding to one cycle on the circular display one scale mark of the old waveform is cleared when the remaining amount of waveform reaches one scale mark clear the entire waveform when one cycle of the waveform has been recorded.
7.6 Setting DX100, DX200, MV100, MV200 Group/Trip Line Click here (also selectable from [Setting] - [SET [Regular] Setting]) Select the tab of the group to be configured. Enter the group name Turn ON/OFF the trip line display Set the trip line by dragging Set the trip line by entering a value Select the color of the trip line Check the channels that you wish to register in the selected group (blue: ON) Group name Up to 16 characters can be entered for the group name.
7.6 Setting DX100, DX200, MV100, MV200 1 Setting the View Group (DX200, DX200C, MV200 Only) Click here (also selectable from [Setting] - [SET [Regular] Setting]) Enter the view group name Select the type of screen to be displayed or drag & drop 2 3 4 5 6 Type of screens available Select the group to be displayed 7 Setting the Recorder View group Up to four view groups can be registered. 8 Group Name Up to 16 characters can be entered for the group name.
7.6 Setting DX100, DX200, MV100, MV200 Alarm/Relay/Remote 2. Click here (also selectable from [Setting] - [SETUP [Basic] Setting]-[Setting]) 1. Select this tab Select from 1 to 15 times Copy/Paste the selected range Select the controlled item Alarm Select the alarm format. The selected items become blue. Relay AND Set the range of relays (from the first alarm relay) to take the AND logic. All other relays will be set to OR logic. If [NONE] is selected, all relays will operate using the OR logic.
7.
7.6 Setting DX100, DX200, MV100, MV200 Channel (Setting the Burnout and RJC) Set to the positive side (100%) Set to the negative side (0%) Set the reference junction compensation to internal or external Burnout For thermocouple (TC) inputs, select how the measurement results are to be handled when the thermocouple burns out. RJC Volt (uV) When the reference junction compensation is set to [External], set the compensation value in the range from -20000 to 20000.
7.6 Setting DX100, DX200, MV100, MV200 Key Lock/Login DX100/DX200/DX200C/MV200 configuration screen 1 2 3 4 5 6 Turn ON when using user settings Check when using login, auto logout, and user ID. 7 MV100 configuration screen Setting the Recorder 8 9 Setting the key lock • Key Lock When using the key lock function, select whether or not to activate the key lock function (lock or free). Index • Password Enter the password used to release the key lock using up to six characters.
7.6 Setting DX100, DX200, MV100, MV200 • Setup Select whether or not to allow setting changes in the setup mode. Note • • If there is a duplicate [User Name] that is turned ON, the user with the larger user number is turned OFF. If [Setup] of all users that are turned ON is set to [Disable], the [Setup] of the user with the smallest number is set to [Enable]. Timer (Option /M1) You can set three timers to be used in the statistical (TLOG, option) computation.
7.6 Setting DX100, DX200, MV100, MV200 1 Report (Creating Hourly/Daily/Weekly/Monthly Reports, Option /M1) Set the date and time at which to create the report 2 3 4 5 6 Select the channel to be reported Enable (ON)/Disable (OFF) the report channel settings There are 30 channels and 12 channels on the DX200/DX200C/MV200 and DX100/ MV100, respectively. 8 Converting the reference unit time Select whether or not to convert the computed results of the TLOG.
7.6 Setting DX100, DX200, MV100, MV200 Setting the Temperature Unit, Tag/Channel Display, Memory Alarm Time, Displayed Language, Partial Expanded Display, Batch (Option /BT1, Style Number S2 or Later) and Time Zone Click either “Temperature,” “AUX” or “Time zone.” Temperature Select the °C or °F for the temperature unit. Tag/Channel Select whether to use the tag (see “Tag” on page 8-6) or channel number as the measurement/computation channel label.
7.6 Setting DX100, DX200, MV100, MV200 1 Network Setting the TCP/IP Set the IP address Select this tab Set these addresses when using the DNS 2 3 4 5 6 Enter the timeout value when turned ON Setting the FTP Select this tab Select the file transfer destination 7 Setting the Recorder In the case of a CONFIG file, the IP address cannot be configured.
7.6 Setting DX100, DX200, MV100, MV200 Setting the serial communication (option /C2, /C3) Select this tab Note When using Modbus, you must set the protocol to MODBUS or MODBUSMASTER.
7.6 Setting DX100, DX200, MV100, MV200 1 Setting the E-mail (style number S4) Select this tab When Alarm is selected 2 3 4 5 Select the alarm to be transmitted when an alarm occurs. SMTP server: Set up to 64 characters Port number: Set in the range 0 to 65535 Recipient1/2: Set up to 150 characters Sender: Set up to 64 characters Set the reference time for mail When Scheduled is selected transmission 7 Setting the Recorder 6 Set up to 64 characters Set up to 32 characters.
7.6 Setting DX100, DX200, MV100, MV200 • SMTP server name Set the SMTP server name (up to 64 alphanumeric characters) or the IP address of the SMTP server. • Port number Set the port number to use. The default value is [25]. • Recipient Set the transmission destination of the e-mail message using up to 150 alphanumeric characters. You can specify multiple addresses. To specify multiple addresses, delimit the addresses using spaces. • Sender Set the e-mail address using up to 64 alphanumeric characters.
7.6 Setting DX100, DX200, MV100, MV200 1 Changing DX100/DX200/MV100/MV200 system configuration If necessary, change the system configuration such as the presence or absence of options to match the DX/MV that is to be configured. Changing the system configuration initializes the settings of the SET mode and SETUP mode. Perform changes in the system configuration first. The changes in options are reflected in the “Recorder List” window. 2 3 Procedure 1.
7.7 Setting DX1000/DX2000 Changing any of the system configurations, will result in initialization of Hardware Configurator settings. Therefore, perform system configuration before making any other settings. Editing the Settings Below are the settings windows for DX1000 and DX2000. The items which cannot be set are displayed in gray and you cannot input to them. For details of each setting item, see the appropriate DX1000/DX2000 series manual.
7.7 Setting DX1000/DX2000 1 Setting the Measurement Channels, Ext. Channels Enter external input channel settings in the same manner as those of the measurement channel items. Also note that this measurement channel setting screen is only one example; your actual screen may vary. Double-clicking the “CH” cell in this panel opens the “Channel Setting” dialog box (see page 7-50) for input. You can input from either the panel or the dialog box.
7.7 Setting DX1000/DX2000 Input Type (Mode and Range/Type) Correspondence between difference computation, scaling, and square root computation ([DELTA], [SCALE], and [SQRT]) is as follows. Mode SKIP VOLT (voltage) TC (thermocouple) RTD (resistance temperature detector) DI (voltage level/contact input) 1-5 V OFF Yes Yes Yes Yes Yes No DELTA No Yes Yes Yes Yes No SCALE No Yes Yes Yes Yes Yes SQRT No Yes No No No No The list for range/type changes depending on the above settings.
7.7 Setting DX1000/DX2000 1 Ref. CH The reference channel for difference computation. Square Root Computes and displays the square root of the input. This setting can be used only when the input mode is set to VOLT (voltage). As necessary, set the span, scale, and unit. 2 Enter the unit using up to six characters. 3 Unit Low-cut (Can be set when the mode is 1-5V, and when the mode is VOLT with square root (SQRT) selected. ) Select [ON] to use the low-cut function.
7.7 Setting DX1000/DX2000 Calibration Correction Set the input and output values for the calibration correction. The number of set points (including the start and end points) can be specified in the range 2 to 16. Click to delete the selected row. Click to add set points (rows) to the number of calibration set points.
7.7 Setting DX1000/DX2000 1 Alarm Four alarms (Alarm 1 to 4) can be specified on each channel. Type Select H, L, h, l, R, r, T or t. The selectable alarms vary depending on the input mode and computation type. For details, see chapter 3 in the User’s Manual IM04L41B01-01E or IM04L42B01-01E. 2 3 Alarm value Alarm is generated using the specified value as the boundary. The selectable range of alarm values vary depending on the input mode and range.
7.7 Setting DX1000/DX2000 Moving Average To use the moving average, select the sampling count [Times] (2 to 400). Tag and Tag No. You can use the tag name instead of the channel number to be displayed on the screen. This can be selected when [Tag] is [Tag] under [Detail Setting] in the [Basic Setting] tab. Release number 2 or earlier You can enter tags using up to 16 characters. Release number 3 or later You can enter tags using up to 32 characters. You can enter tag numbers using up to 16 characters.
7.7 Setting DX1000/DX2000 1 Partial (Partial Expanded Display) Bound position (%) 2 Set the boundary for the partial expanded display. The range is from 1 to 99%. Boundary Set the value that is to be the boundary between the reduced section and the expanded section in the range of “minimum span value + 1 digit to maximum span value – 1 digit.” For channels that are set to scaling, the selectable range is “minimum scale value + 1 digit to maximum scale value – 1 digit.” Example: Input range: –6 V to 6V.
7.7 Setting DX1000/DX2000 Alarm Mark Displays marks indicating the values of the high and low limit alarms, delay high and low limit alarms, and difference high and low limit alarms. This setting is common with the bar graph display. Mark kind Settings Alarm Fixed Description Indicates green under normal conditions and red when an alarm is activated. Displays a fixed color. Scale display To display alarm point marks, select [ON].
7.7 Setting DX1000/DX2000 Copying and Pasting Setup Data You can copy and paste settings using the [Copy], [Paste], and [Copy Details] buttons. 1 Selecting the Items That You Want to Copy 1. Click the [Copy Detail] button. 2 The item selection dialog box opens. 2. Select the items that you want to copy. Items with a blue box will be copied. 3 Click the [X] button to close the item selection dialog box.
7.7 Setting DX1000/DX2000 Setting One Channel at a Time 1. Double-click the channel you wish to set. 2. The channel setting dialog box opens. Set the maximum possible value Set the minimum possible value For Ext channels The items in the measurement channel tab can be configured for each channel. The items that are configured are the same as those configured on the spreadsheet. For details, see the page corresponding to the item.
7.7 Setting DX1000/DX2000 1 Setting the Computation Channels Double-clicking the “CH” cell in this panel opens the “Channel Setting” dialog box (see page 7-52) for input. You can input from either the panel or the dialog box.
7.7 Setting DX1000/DX2000 Turning Computation ON/OFF Set whether or not to perform computation for each computation channel. Entering Expressions Enter an expression using up to 120 characters. You can display the variables or constants list and add one of the variables or constants in the list to your expression simply by clicking it. For details related to the expression, see the DX1000/DX2000 User’s Manual. Click the tab to display a list of that item [Memory] tab has been added in release number 3.
7.7 Setting DX1000/DX2000 1 Rolling Average ON/OFF To take the rolling average of the measured results, select [ON]. Interval Select the sampling interval when taking the rolling average from the following: The sampling interval takes on a value that is an integer multiple of the scan interval. For example, if the sampling interval is set to 5 s when the scan interval is 2 s, the actual sampling interval is 6 s.
7.7 Setting DX1000/DX2000 Setting One Computation Channel at a Time 1. Double-click the channel you wish to set. 2. The channel setting dialog box opens. Clicking here and selecting the list of operators switches the display Select arbitrary channels from the measure channel, Math channel, and Ext channel tab pages, then select arbitrary operators to create an expression.
7.7 Setting DX1000/DX2000 1 Entering General Settings Daylight Saving Time 2 3 4 Start Time and End Time Set the date and time at which to switch to daylight saving time and the date and time at which to switch to standard time. 5 Group Click to display the channel configuration/trip line settings dialog box. 6 7 Setting the Recorder 8 9 Index Select channels to register to the group, or set the trip line.
7.7 Setting DX1000/DX2000 Channel Configuration • Use Select [ON] for the display groups that you want to display. The number of groups is as follows Model DX1000 DX2000 Multi Batch Function (/BT2 option) Disabled or not installed 10 36 Enabled 6/batch 12/batch • Group name Set the group name.
7.7 Setting DX1000/DX2000 1 Display 2 3 4 5 6 7 Select the time corresponding to 1 division of the time axis on the trend display from below: You cannot specify a trend interval that is faster than the scan interval. See the table under “Save Interval” below. 15s*, 30s, 1min, 2min, 5min, 10min, 15min, 20min, 30min, 1h, 2h, 4h, and 10h * Can be set on the DX1002, DX1002N, DX1004, DX1004N, DX2004 and DX2008.
7.7 Setting DX1000/DX2000 Circular Save Interval Select the size of a record data file. The recorded data is divided by the file size specified here. The available settings vary in the range of [10min] to [31day] depending on the [Time Per revolution] setting. Circular Offset Time The time at the reference position on the circle can be offset in unit of an hour up to 23 hours. The available settings vary depending on the [Time Per revolution] setting.
7.7 Setting DX1000/DX2000 1 Bar Graph Direction Select Bar graph direction. Brightness Select a value from 1 to 6 (2 by default). Larger the value, brighter the display becomes. Backlight Save Mode 2 Settings Off Dimmer Timeoff 3 Description Disables the backlight saver. Dims the display if there is no operation for a given time. Turns the backlight OFF if there is no operation for a given time. Backlight Saver Time Select a value from 1 min to 1 h.
7.7 Setting DX1000/DX2000 View Group Set the screens that will be displayed in the 4 panel display. This function is for the DX2000 only. With revision R7.21 or later, you can open a settings dialog box for any view group by double-clicking its number. Double-click a number to display the dialog box for entering settings in each screen of the group.
7.7 Setting DX1000/DX2000 1 Message 2 3 4 Enter a message to be written to the group of up to 32 alphanumeric characters.
7.7 Setting DX1000/DX2000 Comment (Release number 3 or later) Click a number to open a comment text details dialog box Change the values in the [Comment txt field no] boxes to display the registered character strings Set the Comment text field numbers for all lines, and click OK Comment text fields • Number and Text info You can register text strings to Text info boxes. Text string: You can enter up to 32 characters.
7.7 Setting DX1000/DX2000 Annunciator (Release number 3 or later) These settings are activated when the annunciator mode is set to [ON] (by accessing [Basic Setting] > [Alarm] > [Alarm action] > Annunciator mode]).
7.7 Setting DX1000/DX2000 Timer Changes the upper/lower display area Timer used by event action. Used also in the TLOG computation of the computation function. The table below shows the number of timers supported by the DX1000 and DX2000. Model Models without the multi batch function (/BT2 option) Models with the multi batch function (/BT2 option; release number 3 or later) Number of Timers 4 12 When Using an Absolute Timer • Mode Select [Absolute].
7.7 Setting DX1000/DX2000 Match Time Timer Set the time match condition used in event action. You can set the time condition that is used by the event action function. The table below shows the number of match time timers supported by the DX1000 and DX2000. Model Models without the multi batch function (/BT2 option) Models with the multi batch function (/BT2 option; release number 3 or later) Number of Match Time Timers 4 12 1 2 3 • Kind Day Week Month Year Set the time match condition of a day.
7.7 Setting DX1000/DX2000 Manual Sample On a DX2000 with the external input channel (/MC1) option, specify the channel that will be manually sampled. On all other models, all channels will be manually sampled so this setting is not necessary. Click to display a channel selection dialog box.
7.7 Setting DX1000/DX2000 1 Event Action 2 3 4 5 Event Action No. You can set up to 40. 6 Event The condition to execute the action. Settings Description NONE Not use. Remote Select the remote control input terminal number. Relay Select the alarm output relay number. *2 Relay off Select the alarm output relay number. Switch Select the internal switch number. *2 Switch off Select the internal switch number. Timer Select the timer number. Match Time Select the match timer number.
7.7 Setting DX1000/DX2000 Action The action to be executed when an event occurs. Settings Memory Start/Stop Memory Start Memory Stop *2 Trigger AlarmACK Math Start/Stop MathStart MathStop Math Reset Save Display Data Save Event Data Message Snapshot Display Update Interval Change Manual Sample Timer Reset Display Group Change Flag Time ADJUST *2 Panel Load *1 Alarm Display Reset Comment Display *1 Favorite Display *1 Description Can be specified when the DX is configured to record event data.
7.7 Setting DX1000/DX2000 1 File When the multi batch function (/BT2 option; release 3 or later) is disabled 2 3 4 5 When the multi batch function (/BT2 option; release 3 or later) is enabled 6 7 Setting the Recorder 8 9 Index Directory name Set the name of the directory on the storage medium for saving the data on the external storage medium. (Up to 20 characters) Symbols that can be used: #, %, (, ), +, -, ., @, °, and _.
7.7 Setting DX1000/DX2000 Structure Sets the structure of the file name when saving data. Settings Date Serial Batch Description Serial number + user-assigned character string + date Serial number + user-assigned character string Serial number + batch name (when using the batch function) File name Set the user-assigned section of the file name. (Up to 16 characters) Symbols that can be used: #, %, (, ), +, -, ., @, °, and _. Field Title, Field Characters Set text strings.
7.7 Setting DX1000/DX2000 Event Data 1 2 Event related settings are enabled when [Data Kind] is set to [E+D] or [Event] in [Basic Environment] under [Environment] in the [Basic Setting] tab. Sample rate Select the data recording interval from the available settings. See the description for “Data length” on the next page. You cannot specify a sampling rate that is faster than the scan interval. Mode Settings Free Single Repeat Description Records data continuously.
7.7 Setting DX1000/DX2000 Custom Menu You can show or hide items on the menu that appears when you press the FUNC key and on the display selection menu, which appears when you press the DISP/ENTER key. Menu The display selection menu appears when the DISP/ENTER key is pressed.
7.7 Setting DX1000/DX2000 1 Web Report (Release number 3 or later) 2 3 This appears when you click the Item column. 4 5 Slider to adjust the size of the top and bottom display areas 7 Setting the Recorder Click a channel box to open the report channel selection dialog box The report channels you select are assigned. 6 8 These settings affect how report data in the internal memory is displayed on the operator and monitor pages. You can create 10 report layouts.
7.7 Setting DX1000/DX2000 Entering Basic Settings Environment Basic Environment • Data Kind Settings Display E+D Event Description Records display data. Records display data and event data. You cannot select [E+D] when [Trend Rate Switching] under [Environment] - [Detail Setting] under the [Basic setting] tab is set to [ON]. You cannot select [E+D] if you are using the multi batch function (/BT2 option; release number 3 or later).
7.7 Setting DX1000/DX2000 1 • Date format Settings Y/M/D M/D/Y D/M/Y D.M.Y Display Example 2005/11/30 11/30/2005 30/11/2005 30.11.2005 2 Applied Range The format is applied to the date displayed on the screen. It does not change the date format on the setup screen of the date/time, the date in the output data via communications, the date saved along with the data, and the date used in the data file names.
7.7 Setting DX1000/DX2000 Detail Setting • Tag Settings Tag Channel Description Displays tags or tag numbers. Channel numbers are displayed for channels that do not have tags or tag numbers assigned to them. Displays channel numbers. • Tag No. (Release number 3 or later) Select [ON] to use tag numbers. • Language Select the display language • Remote controller ID Select the remote controller ID from 0 to 31. When not using the remote control terminal, select [OFF].
7.7 Setting DX1000/DX2000 1 • Batch Batch (when the multi batch function is not installed) Select [ON] to use the batch function. Batch operation qty (when the /BT2 multi batch function is installed; release number 3 or later) 2 Specify the number of batches to use. Settings OFF 1 2 or higher Description Disables the multi batch function and the batch function. Enables the single batch function. Enables the multi batch function.
7.7 Setting DX1000/DX2000 • Scale over Settings Free Description The value is set to –over range if the value is less than –30000 and +over range if the value is greater than 30000 excluding the decimal point. The value is displayed as –Over and +Over, respectively. The value is set to –over range if the value is less than –5% of the scale and +over range if the value is greater than 105%. The value is displayed as –Over and +Over, respectively. Over Example: If the scale is 0.0 to 200.
7.7 Setting DX1000/DX2000 1 Option 2 3 4 5 • Value on Error 6 Specify whether to set the display for a computation error to [+Over] or [–Over]. • Overflow Sum, Ave Specify how to handle overflow data when it is detected in the SUM or AVE computation of TLOG or CLOG. This setting is also applied to report generation. Description Sets the computed result to computation error. Discards the overflow data and continues the computation.
7.7 Setting DX1000/DX2000 • Set Calibration (Release numbers 4 and later) To use calibration management, select [ON]. Notification You can specify how many days before the calibration due date you want to display the calibration notification screen. You can set the number of days to a value between 1 and 10. Renotification You can specify the period at which to display the calibration notification screen. The calibration notification screen will continue to appear until calibration is completed.
7.7 Setting DX1000/DX2000 FTP Transfer at Signing You can transfer measured data files (display or event data files) to an FTP server after you sign them. You need to configure the FTP client settings so that display and event data are transferred. Setting On Off Description Measured display and event data files are only transferred to an FTP server after they are signed. Also, the [Transfer wait time] settings are invalid; transfer is executed immediately.
7.7 Setting DX1000/DX2000 Alarm Reflash To set the reflash operation on the alarm output relay, select [ON]. The reflash function is set on the first three output relays. Settings Description Off Reflash is not used. *1 On Reflash is used. The relays are deactivated for approximately 500 ms. *2 500ms Reflash is used. The relays are deactivated for approximately 500 ms. *2 1s Reflash is used. The relays are deactivated for approximately 1 s. *2 2s Reflash is used.
7.7 Setting DX1000/DX2000 Relay AND Select the relays that are to operate using AND logic. Set the range of relays (from the first alarm relay) to take the AND logic. All subsequent relays will be set to OR logic. Available settings are [None], [I01] (I01 only), [I01-I02] (I01 and I02), [I01-I03] (I01 to I03), etc. Only alarm output relays that are installed are valid. 1 2 Relay action Select whether the alarm output relay is energized or de-energized when an alarm occurs.
7.7 Setting DX1000/DX2000 Alarm action • No Logging Select [ON] to hide alarm indication. The [Detect] setting is enabled in the Measure channel, Math channel, Ext channel tab(s). This function disables the alarm indicator and the logging of alarm events to the alarm summary. It also disables the display of alarms by the alarm annunciator (release number 3 or later). • Annunciator mode and Sequence (Release number 3 or later) To use the annunciator function, select [ON] and set the sequence.
7.7 Setting DX1000/DX2000 1 Scan Interval 2 Scan interval Select the scan interval. You cannot select fast sampling mode (125 ms) on the following models: • Models equipped with external input channels (/MC1 option) • Models with the multi batch function (/BT2 option; release number 3 or later) 3 4 A/D integrate Select the A/D integration time as necessary. Only the selectable settings are displayed.
7.7 Setting DX1000/DX2000 Measure Function Burnout Settings OFF UP DOWN Description Sensor disconnections are not detected. When the sensor burns out, the measured result is set to +over range. The measured value displays “Burnout.” For 1-5V input, the DX assumes that the sensor has burned out when the measured value exceeds the scale upper limit by 10% of the scale width.
7.7 Setting DX1000/DX2000 Report 1 Click to display the channel selection screen. Channel selection screen Click the channel you wish to set up 2 3 4 5 Report kind Select the type of report to be created. Settings OFF Hour Day Hour+Day Day+Week Day+Month Description Do not create a report. Creates hourly reports. Creates daily reports. Creates hourly and daily reports. Creates daily and weekly reports. Creates daily and monthly reports.
7.7 Setting DX1000/DX2000 Remote (Release number 3 or later) Number Remote control terminal numbers. The number of settings that appears corresponds to the number of remote control terminals. Remote Input Specify an operation for each remote control terminal. Settings N.O N.C 7-92 Description The remote signal rises when the contact input switches from open to closed, and it falls when the contact input switches from closed to open.
7.7 Setting DX1000/DX2000 1 Key Lock 2 3 4 5 Enabled when [Key Security] is set to [Keylock] under [Environment] - [Detail Setting] in the [Basic Setting] tab. This function is not available on DXs with the /AS1 advanced security option. 6 Password The password used to release the key lock. An entered password is displayed as “********.” (Up to 8 characters) 7 Key, Function, Media Setting the Recorder Select whether or not to disable each item.
7.7 Setting DX1000/DX2000 User Registration You cannot configure these settings on DXs with the /AS1 advanced security option. You can set the [User Registration] when [Login] is selected as [Key Security] or [Comm. Security] under [Environment] - [Detail Setting] in the [Basic Setting] tab. Supervisor • Auto Logout Time Settings OFF 1min to 10min Description Does not log out until the logout operation is executed. Automatically logs out when there is no key operation for a specified time.
7.7 Setting DX1000/DX2000 1 User Up to 30 names can be registered. 2 3 4 5 Click to display a dialog box for selecting items to copy/paste Changes the upper/lower display area Example of the dialog box displayed when the Detail button is clicked Select the check boxes (blue) of the items you wish to copy and paste 7 Setting the Recorder • Mode 8 The available settings vary depending on the [Security] setting. Settings OFF Key Comm Web Key+Comm Description Not register. Log into the DX using keys.
7.7 Setting DX1000/DX2000 Ethernet TCP/IP Set the IP address to a fixed IP address or obtain it automatically (DHCP). Consult with your network administrator for the network parameters such as the IP address, subnet mask, default gateway, and DNS. When using a fixed IP address • DHCP Set [DHCP] to [OFF]. • IP Address Set the IP address to assign to the DX1000/DX2000. • Subnet Mask Set the subnet mask according to the system or network to which the DX1000/ DX2000 belongs.
7.7 Setting DX1000/DX2000 1 When obtaining the IP address from DHCP • DHCP Set [DHCP] to [ON]. • DNS accession To automatically obtain the DNS server address, select [ON]. Otherwise, select [OFF]. If you select [OFF], you must set the IP address of the DNS server. • Host-Name Register To automatically register the host name, select [ON]. 2 3 • Host Name Set the DX1000/DX2000’s host name using up to 64 alphanumeric characters.
7.7 Setting DX1000/DX2000 FTP The data files are automatically transferred to the FTP destination. File Type Display data file Event data file Report file Snapshot data file Setting * Description Data files are automatically transferred at each file save interval. Files are automatically transferred when the data length of data is recorded. Data files are automatically transferred every time a report is created. The files are automatically transferred when a snapshot is executed.
7.7 Setting DX1000/DX2000 Setting the FTP connection destination Consult your network administrator when setting parameters such as the primary/ secondary FTP servers, port number, login name, password, account, and availability of the PASV mode. • Primary, Secondary 1 2 You can specify two destination FTP servers, [Primary] and [Secondary]. If the primary FTP server is down, the file is transferred to the secondary FTP server.
7.7 Setting DX1000/DX2000 MODBUS Client Communication interval Set the read cycle to 125ms, 250ms, 500ms, 1s, 2s, 5s, or 10s. Auto recovery Set the interval for retrying the connection when the connection is interrupted for some reason. Select OFF, 10s, 20s, 30s, 1min, 2min, 5min, 10min, 20min, 30min, or 1h. Modbus Server setting • Server No. Select from 1 to 16 for the server registration numbers to be configured. • Port No. Enter the port number in the range of 0 to 65535 for the selected server.
7.7 Setting DX1000/DX2000 1 Command setting • Client command No. Select from 1 to 16 for the transmitted command numbers to be configured. • Command 2 Set the command type. Settings Read R-Math Write W-Math Exchange-M Description Read to the external input channel (16-bit signed integer type) from the server. Read to the communication input data (32-bit floating point type) from the server. Write the measurement channel (16-bit signed integer type) to the server.
7.7 Setting DX1000/DX2000 E-mail Set the SMTP server and mail address. • SMTP server name Enter the host name or IP address of the SMTP server. • Port No. Unless specified otherwise, set the number to the default value. The default value is 25. • Security (Release number 3 or later) Select [POP before SMTP] if you need to enable POP before SMTP. To enable authenticated e-mail transmission (Authentication SMTP), select [Auth] (release numbers 4 and later).
7.7 Setting DX1000/DX2000 • Send delay [second] Set the delay between POP3 server authentication and transmission to a value from 0 to 10 seconds. • POP3 Login To encrypt the password when logging into the POP3 server, select APOP. To send it in plain text, select PLAIN. Auth. Settings (Release number 4 or later) To enable support for authenticated e-mail transmission (Authentication SMTP), set a user name and password to use for authentication. • User name 1 2 3 4 Enter the user name.
7.7 Setting DX1000/DX2000 Scheduled Specify the settings for sending e-mail at scheduled times. • Recipient1 and Recipient2 Set the e-mail recipients. For Recipient1 and Recipient2, select [ON] to send e-mail or [OFF] to not send e-mail. • Interval Select the interval for sending e-mail to Recipient1 and Recipient2 from 1, 2, 3, 4, 6, 8, 12, and 24 hours. • Ref. time Enter the time used as a reference for sending the e-mail at the specified interval to Recipient1 and Recipient2.
7.7 Setting DX1000/DX2000 1 System 2 3 Specify the settings for sending e-mail when the DX recovers from a power failure, at memory end, when an error occurs, and when there is an invalid user (only on DXs with the /AS1 advanced security option). • Recipient1 and Recipient2 Set the e-mail recipients. For Recipient1 and Recipient2, select [ON] to send e-mail or [OFF] to not send e-mail.
7.7 Setting DX1000/DX2000 Report Settings Specify the settings for sending e-mail when reports are created. • Recipient1 and Recipient2 Set the recipients. For Recipient1 and Recipient2, select On to send e-mail or OFF to not send e-mail. • Include source URL, Subject, and Header These items are the same as the e-mail that is sent when an alarm occurs. The default subject is Report_data.
7.7 Setting DX1000/DX2000 1 SNTP Client 2 3 • Use Select [Use] to use the SNTP client function; Otherwise, select [Not]. If you select [Use], the SNTP client settings are displayed. 4 • Server Name Set the SNTP server name using up to 64 alphanumeric characters. • If the DNS is used, you can set the host name as a server name. • You can also set the IP address. In this case, the DNS is not required. 5 • Port No.
7.7 Setting DX1000/DX2000 Server Function • Use Select [Use] or [Not] (don’t use). • Web server Use For the Web item under Server, select [Use] or [Not] (don’t use). When [Use] is selected, the Web page item is added to the basic setting mode menu. • Operator To set the operator page, select [ON]. • Operator Access Control To use access control, select [ON]. You must enter a user name and password to display the operator page. You must select [Login] as [Key Security] or [Comm.
7.7 Setting DX1000/DX2000 1 Connect limits (Release number 3 or later) 2 3 4 5 Modbus Server • Connect limits Select [ON] to place connection limits. • Allowed IP Address If you want to only allow certain IP addresses to connect to the DX Modbus server, set [Use] to [ON] and enter IP addresses (in the range of 0.0.0.0 to 255.255.255.255) in the [Allowed IP Address] boxes. You cannot enter host names. Only the IP addresses specified here can connect to the DX Modbus server.
7.7 Setting DX1000/DX2000 Password Management (Only on DXs with the /AS1 advanced security option) Certification Key • Host Principal The DX account name registered on the KDC server. You can enter up to 20 alphanumeric characters. • Realm Name The name of the domain that contains the KDC server and the DX. You can enter up to 64 alphanumeric characters. • Password Set the password to use to access the KDC server using up to 20 characters. The password is displayed as “**********.
7.7 Setting DX1000/DX2000 1 Serial 2 3 For RS-232 • Baud Rate 4 Select 1200, 2400, 4800, 9600, 19200, or 38400 (bps). • Parity Set the parity check method to Odd, Even, or None. 5 • Data length Select 7 or 8 (bits). To output the data in binary format, select 8. • Handshaking 6 Select Off:Off, XON:XON, XON:RS, or CS:RS. • Address For Modbus protocol, enter a value in the range of 1 to 99. For a general purpose communication protocol, this value is not set.
7.7 Setting DX1000/DX2000 Modbus master Modbus master settings are enabled when you set [Protocol] to [Master] under [Serial] [Serial] in the [Basic Setting] tab. Basic setting • Read cycle Set the read cycle to 125ms, 250ms, 500ms, 1s, 2s, 5s, or 10s. • Timeout Set the command timeout value to 125ms, 250ms, 500ms, 1s, 2s, 5s, 10s, or 1min. • Retrials Set the number of retrials when there is no response from the slave. Select OFF, 1, 2, 3, 4, 5, 10, or 20.
7.7 Setting DX1000/DX2000 • Start channel/End channel (master channel numbers) Enter the first and last channel numbers of input/output. The range of channels that you can enter varies depending on the command type as follows: Read: 201 to 440, R-Math: C01 to C60, Write: 1 to 48, W-Math: 101 to 160 Exchange-M (release numbers 4 and later): C01 to C60 1 2 • Address Enter the address of the slave device in the range of 1 to 247. • Register Set the register number of the server.
7.7 Setting DX1000/DX2000 PROFIBUS-DP (Release number 3 or later) PROFIBUS-DP • Node Address Set to a number from 0 to 125.
7.
7.7 Setting DX1000/DX2000 Changing DX1000/DX2000 system configuration If necessary, change the system configuration such as the presence or absence of options to match the DX1000/DX2000 that is to be configured. Changing the system configuration initializes the settings of the SET mode and SETUP mode. Perform changes in the system configuration first. The changes in options are reflected in the “Recorder List” window. Procedure 1.
7.8 1 Setting MV1000/MV2000 To change the system configuration and create setup data, first execute “Changing the MV1000/MV2000 System Configuration” on page 7-136. 2 Editing Settings Display the MV1000 and MV2000 setup wizard and click the Setup tab, or select a setting item from a menu in the menu bar. Items for settings that are unavailable are dimmed, and those settings cannot be edited. For details on each installation item, see the MV1000/MV2000 manual.
7.8 Setting MV1000/MV2000 Setting the Measurement Channels, Ext. Channels Enter external input channel settings in the same manner as those of the measurement channel items. Also note that this measurement channel setting screen is only one example; your actual screen may vary.
7.8 Setting MV1000/MV2000 Input Type (Mode and Range/Type) Correspondence between difference computation, scaling, and square root computation ([DELTA], [SCALE], and [SQRT]) is as follows. Mode SKIP VOLT (voltage) TC (thermocouple) RTD (resistance temperature detector) DI (voltage level/contact input) 1-5 V OFF Yes Yes Yes Yes Yes No DELTA No Yes Yes Yes Yes No SCALE No Yes Yes Yes Yes Yes SQRT No Yes No No No No 1 2 3 The list for range/type changes depending on the above settings.
7.8 Setting MV1000/MV2000 Low-cut (Can be set when the mode is 1-5V, and when the mode is VOLT with square root (SQRT) selected. ) Select [ON] to use the low-cut function. Low-cut value (Can be set when the mode is VOLT with square root (SQRT) selected.) Set the low-cut value in the range of 0.0% to 5.0% of the input span. Measured value Result of square root computation Low-cut value Input value Calibration Correction Set the input and output values for the calibration correction.
7.8 Setting MV1000/MV2000 1 Alarm Four alarms (Alarm 1 to 4) can be specified on each channel. Type Select H, L, h, l, R, r, T or t. The selectable alarms vary depending on the input mode and computation type. For details, see chapter 3 in the MV1000/MV2000 User’s Manual (IM MV1000-01E). 2 3 Alarm value Alarm is generated using the specified value as the boundary. The selectable range of alarm values vary depending on the input mode and range.
7.8 Setting MV1000/MV2000 Memory Sampling Turn [ON] (sample) or [OFF] (do not sample). Display Zone (Zone L and U) You can select the range of the screen in which the waveform of each channel is to be displayed. Specify positions (%) on the display scale for the upper and lower limits. The conditions for setting the zones are as follows: • Range: 0% to 100% The lower limit L must be less than the upper limit • The difference between the lower and upper limits is at least 5%.
7.8 Setting MV1000/MV2000 Color (Display Color) 1 You can select the display color of each channel from 24 colors. Green Band Displays a specified section of the measurement range using a color band on the scale. This setting is common with the bar graph display. 2 Region (Band area) Settings Inside Outside OFF Description Displays the area inside using the color band. Displays the area outside using the color band. Disables the function. 3 Color 4 Set the display color.
7.8 Setting MV1000/MV2000 Copying and Pasting Setup Data The items checked in [Copy Details] can be copied and pasted. Click the channel number to select the copy source or paste destination. To select multiple channels to be copied, drag the channel number to specify the range to be copied. To select multiple paste destinations, select the range in a similar fashion.
7.8 Setting MV1000/MV2000 Setting One Channel at a Time 1 1. Double-click the channel you wish to set. 2 2. The channel setting dialog box opens. 3 4 5 6 7 Setting the Recorder 8 Set the maximum possible value Set the minimum possible value 9 For Ext channels Index The items in the measurement channel tab can be configured for each channel. The items that are configured are the same as those configured on the spreadsheet. For details, see the page corresponding to the item.
7.
7.8 Setting MV1000/MV2000 Use (Turning ON/OFF Computation) 1 Select whether or not to perform computation for each channel. Entering Expressions Enter an expression using up to 120 characters. You can display the variables or constants list and add one of the variables or constants in the list to your expression simply by clicking it. For details related to the expression, see the MV1000/MV2000 User’s Manual.
7.8 Setting MV1000/MV2000 Rolling Average ON/OFF To take the rolling average of the measured results, select [ON]. Interval Select the sampling interval when taking the rolling average from the following: The sampling interval takes on a value that is an integer multiple of the scan interval. For example, if the sampling interval is set to 5 s when the scan interval is 2 s, the actual sampling interval is 6 s.
7.8 Setting MV1000/MV2000 Setting One Computation Channel at a Time 1 1. Double-click the channel you wish to set. 2 2. The channel setting dialog box opens. Clicking here and selecting the list of operators switches the display Select channels on the Measure channel, Math channel, and Ext channel tabbed pages and select desired operators to create an expression. 3 4 5 6 7 Setting the Recorder 8 9 The items in the math channel tab can be configured for each channel.
7.8 Setting MV1000/MV2000 Group Click to display the channel configuration/trip line settings dialog box. Select channels to register to the group, or set the trip line. Use Turn On the groups you want to use. Group name Set the group name. (up to 16 characters) Channel Configuration Set up to 10 channels (MV2000) or 6 channels (MV1000) from measurement channels, computation channels (/M1 and /PM1 options), and external input channels (/MC1 option, MV2000).
7.8 Setting MV1000/MV2000 Trip line 1 Set lines at specified positions in the waveform display range on the Trend display. • Use Turn [ON] the trip lines you want to display. 2 • Position Set the position in the range of 0 to 100% of the display width. • Color The default colors are red, green, blue, and yellow. If you want to change the color, select from the 24 available colors. 3 • Trend Line Set the line width of the trip line in dots (1 to 3).
7.8 Setting MV1000/MV2000 Save Interval (when recording display data) Select the size of a record data file. The recorded data is divided by the file size specified here. The available settings vary depending on the Trend interval setting.
7.8 Setting MV1000/MV2000 Backlight Saver Time Select a value from 1 min to 1 h. If the specified time elapses without any key operation or alarm occurrence, the LCD backlight switches to the specified mode. 1 Backlight Restore Settings Key Key&Alarm 2 Description The backlight returns to the original brightness when a key is pressed. The backlight returns to the original brightness when a key is pressed or when an alarm occurs.
7.8 Setting MV1000/MV2000 View Group Set the screens that will be displayed in the 4 panel display. This function is for the MV2000 only. With revision R7.21 or later, you can open a settings dialog box for any view group by double-clicking its number. View group number Enter the view group name Select the type of views to be displayed or drag and drop the view icons Select the group to be displayed Selectable view types Group Name Up to 16 characters can be entered for the group name.
7.8 Setting MV1000/MV2000 Message 1 2 3 4 Enter a message to be written to the group of up to 32 alphanumeric characters. 5 Timer 6 7 Setting the Recorder 8 9 Changes the upper/lower display area Timer Timer used by event action. Used also in the TLOG computation of the computation function. Up to four timers (1 to 4) can be set. • When Using an Absolute Timer • Mode Select [Absolute]. • Time interval Select the interval from the available settings between 1min to 24h. • Ref.
7.8 Setting MV1000/MV2000 Match Time Timer Set the time match condition used in event action. These timers are also used in TLOG computation of the computation function. You can set four match time timers (1 to 4). • Kind Daily Set the time match condition of a day. Weekly Set the time match condition of a week. Monthly Set the time match condition of a month. Year Sets the time match condition for a year. Set the items with check marks in the following table depending on the Kind setting.
7.8 Setting MV1000/MV2000 Event Action 1 2 3 4 5 Event Action No. You can set up to 40. Event The condition to execute the action. 6 Description Not use. Select the remote control input terminal number. Select the alarm output relay number. Select the internal switch number. Select the timer number. Select the match timer number. - 7 8 Action The action to be executed when an event occurs.
7.8 Setting MV1000/MV2000 File Directory name Set the name of the directory on the storage medium for saving the data on the external storage medium. (Up to 20 characters) Symbols that can be used: #, %, (, ), +, -, ., @, °, and _. Strings that cannot be used: AUX, CON, PRN, NUL, CLOCK, COM1 to COM9, and LPT1 to LPT9. Header Set the header comment to be written to the data file. (Up to 50 characters) Structure Sets the structure of the file name when saving data.
7.8 Setting MV1000/MV2000 Event Date 1 2 3 Event related settings are enabled when [Data Kind] is set to [E+D] or [Event] in [Basic Environment] under [Environment] in the [Basic Setting] tab. Sample rate Select the data recording interval from the available settings. You cannot specify a sampling rate that is faster than the scan interval. 5 Mode Settings Free Single Repeat 4 Description Records data continuously. Records data when the trigger condition is met.
7.8 Setting MV1000/MV2000 Custom Menu Menu The display selection menu appears when the DISP/ENTER key is pressed. Click to select Type of main menus being set Sub menu Changes the left/right display area Delete selected items Click to display a sub menu on the right side of the screen Add an item beneath the selected item Function The FUNC key menu appears when the FUNC key is pressed.
7.8 Setting MV1000/MV2000 Entering Basic Settings 1 Environment Basic Environment 2 3 4 5 • Data Kind Settings Display E+D Event Description Records display data. Records display data and event data. [E+D] cannot be selected when [Trend Rate Switching] is turned ON under [Environment] - [Basic Environment] in the [Basic Setting] tab. Records event data. Select C or F. • Time zone Set the time zone of the region in which the MV will be used in terms of the time difference from GMT.
7.8 Setting MV1000/MV2000 • Service port The following table indicates the number of simultaneous uses (number of users that can use the function simultaneously), the maximum number of connections, and the port number for each function. Function FTP server Web server (HTTP) SNTP server Modbus server Instrument information server Maximum Number of Connections 2 1 – 2 – Number of Simultaneous Uses Administrator User 2 – – – – *1 2 – – – – Port No.
7.8 Setting MV1000/MV2000 • Batch 1 Select [ON] to use the batch function. • Digit of lot number Select the number of digits of the lot number from 4, 6, or 8. Select [OFF] to disable the lot number. • Auto increment ON Automatically sets the lot number of the next measurement to “the lot number of the current measurement + 1.” • Partial Turn Partial [ON] (partially expand) or [OFF] (do not partially expand).
7.8 Setting MV1000/MV2000 • Auto Save Settings ON OFF Description Automatically saves the measured data to the CF card. Does not automatically save the data. Save the measured data manually to the CF card or USB flash memory (/USB1 option). • Media FIFO You can select this with MV main unit firmware version 2.0x or later. This is valid only when [Auto Save] is [ON]. Settings ON OFF Description If there is no more free space on the CF card, the oldest file is deleted, and the newest file is saved.
7.8 Setting MV1000/MV2000 • File kind Set this item when creating two types of reports such as daily report and monthly report. Settings Split Combined Description Saves each type of report to a separate file. Saves the report data of two types in a single file. 1 2 Alarm 3 4 5 6 Reflash To set the reflash operation on the alarm output relay, select [ON]. The reflash function is set on the first three output relays.
7.8 Setting MV1000/MV2000 Relay hold Select the alarm output relay behavior from below: The setting applies to all relays. Settings Description Unhold Turns the output relay OFF when the alarm condition is released (returns to normal condition). Holds the output relay at ON until an alarm acknowledge operation is performed. Hold Relay Action on ACK Settings Normal Reset Description The relay output is deactivated when the alarm ACK operation is executed.
7.8 Setting MV1000/MV2000 Measure Function 1 2 3 4 5 Burnout Settings OFF UP DOWN RJC Mode Sets the reference junction compensation method of the thermocouple input. Select [Internal] or [External]. Settings Internal External Description Uses the reference junction compensation function of the MV. Uses an external reference junction compensation function. When set to [External], [Volt] is displayed. 7 8 9 Index RJC voltage (µV) The compensation voltage to be added to the input.
7.8 Setting MV1000/MV2000 Report Click to display the channel selection screen. Channel selection screen Click the channel you wish to set up Report kind Select the type of report to be created. Settings OFF Hour Day Hour+Day Day+Week Day+Month Description Do not create a report. Creates hourly reports. Creates daily reports. Creates hourly and daily reports. Creates daily and weekly reports. Creates daily and monthly reports.
7.8 Setting MV1000/MV2000 Key Lock 1 2 3 4 5 Enabled when [Key Security] is set to [Keylock] under [Environment] - [Detail Setting] in the [Basic Setting] tab. 6 Password 7 The password used to release the key lock. (Up to 8 characters) Key, Function, Media Settings Free Lock Setting the Recorder Select whether to lock each item. Description Key lock not applied. Disables the operation.
7.8 Setting MV1000/MV2000 User Registration You can set the [User Registration] when [Login] is selected as [Key Security] or [Comm. Security] under [Environment] - [Detail Setting] in the [Basic Setting] tab. Supervisor • Auto Logout Time Settings OFF 1min to 10min Description Does not log out until the logout operation is executed. Automatically logs out when there is no key operation for a specified time.
7.8 Setting MV1000/MV2000 User 1 Up to 30 names can be registered. 2 3 4 5 Changes the upper/lower display area • Mode 6 The available settings vary depending on the [Security] setting. Description Not register. Log into the MV using keys. Log into the MV via communications. Log into the monitor page of the MV using a Web browser. Log into the MV using keys and via communications.
7.8 Setting MV1000/MV2000 Ethernet TCP/IP Set the IP address to a fixed IP address or obtain it automatically (DHCP). Consult with your network administrator for the network parameters such as the IP address, subnet mask, default gateway, and DNS. When using a fixed IP address • DHCP Set [DHCP] to [OFF]. • IP Address Set the IP address to assign to the MV1000/MV2000. • Subnet Mask Set the subnet mask according to the system or network to which the MV1000/ MV2000 belongs.
7.8 Setting MV1000/MV2000 • Host Name 1 Set the MV1000/MV2000’s host name using up to 64 alphanumeric characters. • Domain Name Set the network domain name that the MV belongs to using up to 64 characters. • Server Primary, Server Secondary (not necessary when DNS accession is enabled) 2 Register up to two IP addresses for the primary and secondary DNS servers. • Domain Primary, Domain Secondary 3 Set up to two domain suffixes: primary and secondary.
7.8 Setting MV1000/MV2000 Setting the FTP connection destination Consult your network administrator when setting parameters such as the primary/ secondary FTP servers, port number, login name, password, account, and availability of the PASV mode. • Primary, Secondary You can specify two destination FTP servers, [Primary] and [Secondary]. If the primary FTP server is down, the file is transferred to the secondary FTP server.
7.8 Setting MV1000/MV2000 MODBUS Client 1 2 3 4 Click to display the channel selection screen Changes the upper/lower display area 5 Communication interval Set the read cycle to 125ms, 250ms, 500ms, 1s, 2s, 5s, or 10s. 6 Auto recovery Set the interval for retrying the connection when the connection is interrupted for some reason. Select OFF, 10s, 20s, 30s, 1min, 2min, 5min, 10min, 20min, 30min, or 1h. 7 Select from 1 to 16 for the server registration numbers to be configured. • Port No.
7.8 Setting MV1000/MV2000 • Start channel/End channel (client channels) Enter the first and last channel numbers of input/output. The range of channels that you can enter varies depending on the command type as follows: Read: 201 to 440, R-Math: C01 to C60, Write: 1 to 48, W-Math: 101 to 160 • Connected to (server number) Select the server number from 1 to 16. • Register Set the register number of the server. For an input register, select in the range of 30001 to 39999 and 300001 to 365536.
7.8 Setting MV1000/MV2000 • Security Settings OFF POPbeforeSMTP 1 Description Disables POP before SMTP. Enables POP before SMTP. • Address 1, Address 2 Enter the e-mail address. Multiple e-mail addresses can be entered in the box of one recipient. When entering multiple addresses, delimit each address with a space. Up to 150 characters can be entered. 2 3 • Sender Enter the sender e-mail address. You can enter up to 64 characters.
7.8 Setting MV1000/MV2000 Scheduled Specify the settings for sending e-mail at scheduled times. • Recipient1 and Recipient2 Set the e-mail recipients. For Recipient1 and Recipient2, select [ON] to send e-mail or [OFF] to not send e-mail. • Interval Select the interval for sending e-mail to Recipient1 and Recipient2 from 1, 2, 3, 4, 6, 8, 12, and 24 hours. • Ref. time Enter the time used as a reference for sending the e-mail at the specified interval to Recipient1 and Recipient2.
7.8 Setting MV1000/MV2000 Report 1 2 3 Specify the settings for sending e-mail when reports are created. • Recipient1 and Recipient2 Set the recipients. For Recipient1 and Recipient2, select On to send e-mail or OFF to not send e-mail. • Include source URL, Subject, and Header 4 These items are the same as the e-mail that is sent when an alarm occurs. The default subject is Report_data.
7.8 Setting MV1000/MV2000 Server Function • Use Select [Use] or [Not] (don’t use). • Web server Use For the Web item under Server, select [Use] or [Not] (don’t use). When [Use] is selected, the Web page item is added to the basic setting mode menu. • Operator To set the operator page, select [ON]. • Operator Access Control To use access control, select [ON]. You must enter a user name and password to display the operator page. You must select [Login] as [Key Security] or [Comm.
7.8 Setting MV1000/MV2000 For RS-232 • Baud Rate 1 Select 1200, 2400, 4800, 9600, 19200, or 38400 (bps). • Parity 2 Set the parity check method to Odd, Even, or None. • Data length Select 7 or 8 (bits). To output the data in binary format, select 8. • Handshaking 3 Select Off:Off, XON:XON, XON:RS, or CS:RS. • Address For Modbus protocol, enter a value in the range of 1 to 99. For a general purpose communication protocol, this value is not set.
7.8 Setting MV1000/MV2000 Basic setting • Read cycle Set the read cycle to 125ms, 250ms, 500ms, 1s, 2s, 5s, or 10s. • Timeout Set the command timeout value to 125ms, 250ms, 500ms, 1s, 2s, 5s, 10s, or 1min. • Retrials Set the number of retrials when there is no response from the slave. Select OFF, 1, 2, 3, 4, 5, 10, or 20. • Inter-block delay Set the inter-block delay to OFF, 5ms, 10ms, 15ms, 45ms, or 100ms. • Auto recovery Set the auto recovery time from communication halt.
7.
7.8 Setting MV1000/MV2000 Changing the MV1000/MV2000 System Configuration If necessary, change the system configuration such as the presence or absence of options to match the MV1000/MV2000 that is to be configured. Changing the system configuration initializes the settings of the SET mode and SETUP mode. Perform changes in the system configuration first. The changes in options are reflected in the “Recorder List” window. Procedure 1.
7.9 1 Setting DARWIN Changing any of the system configurations, will result in initialization of Hardware Configurator settings. Therefore, perform system configuration before making any other settings. If you wish to change the module configuration, see “Changing Module configuration.” 2 3 Selecting Setting Screen Settings screen contents differ depending on whether a DA100, DC100, or DR is the object.
7.9 Setting DARWIN Mode (input type) Scale ON/OFF Power monitor wiring Power monitor input range Measurement range Span left Span right Scale left Scale right Reference channel for Delta or RRJC mode Scale unit Selecting the Range and Type of Input The following types of input can be selected. The default setting is VOLT. • SKIP Measurement, data saving and display (except for page display) will not be carried out.
7.9 Setting DARWIN • AC Power monitor • Setting the Wiring Method for the power monitor Select from the following methods: Single-phase two-wire (1Ph2W) Single-phase three-wire (1Ph3W; 3-wire input modules only) Three-phase three-wire 2 Voltage 2 Current (3Ph3W-2I; 3-wire input modules only). Three-phase three-wire 3 Voltage 3 Current (3Ph3W-3I; 3-wire input module only). Three-phase four-wire (3Ph4W; 3-wire input modules only). • Setting the Input Range Select from the following ranges: 250V-0.
7.9 Setting DARWIN Setting the Span The measurement range is decided according to the type of input. The left and right span must lie within the measurement range. However, the span is 0 to 1 for the DI input type. For the remote RJC, the setting range for span is the same as that for the reference channel. Click the “Range Information” tab on the single channel specific setting screen, to refer the type of input and the measurable range.
7.9 Setting DARWIN Precautions in Power Module Measurement Input the voltage or current being measured at a level between 10% and 100% of the measuring range. The instrument bases its calculations of all other parameters on the frequency of V1. Extra care must therefore be taken when setting the input level of V1. If the input level fails to fall within the given limits, there is no guarantee that the measurement of any other parameters will be reliable.
7.9 Setting DARWIN Selecting the Alarm Printout (DR only) This setting can be selected from the following. The default setting is ON2. OFF: Alarm printout will not be carried out; ON1: Alarms will only be printed out on occurrence. The alarm occurrence mark, channel No. or tag, type of alarm, alarm heading or time of occurrence will be printed with trend recordings. ON2: Alarms will both be printed out on occurrence and release. The alarm occurrence/release mark, channel No.
7.9 Setting DARWIN Partially expanded recording settings Right recording zone Left recording zone Boundary value Interpolation ON/OFF Trend recording ON/OFF Digital print ON/OFF Manual print ON/OFF Scale value print ON/OFF 1 2 List print ON/OFF 3 Setting Recording Zones (ZONE) The set left and right position of the zone correspond to the left and right span set at the SPAN menu (recording span). The minimum width of a zone is 5mm. No decimal points.
7.9 Setting DARWIN Selecting Channels to Save (for DC100, and DR with FDD Option Only) To save measurement data of the DC100, or a DR with FDD Option, to a floppy disk, data will first be saved to an internal RAM disk. Select here the channels to be saved Tag Settings (DC100 or DR Only) Tag setting Set a tag in the setting area below the Tag label. Maximum amount of alphanumerics for DC100: 8; for DR: 16. Additionally allowed symbols #, %, &, ( ), *, +, -, ., and /.
7.9 Setting DARWIN If a DR is connected, you can make print settings in the setting screen that appears when clicking the About Printing tab. 1 2 3 4 5 6 Click the “Range Information” tab to refer the type of input and the measurable range.
7.9 Setting DARWIN For power monitor channels, click the Power Module Information tab. Setting Math Channel Equations Math channels can be set on DARWIN recorders with the computation function (/M1) or the Pulse Module, or DR with FD driver. Math channel ON/OFF Equations Left and right span Unit Making Settings Per Channel The settings in “Channels” screen can also be carried out per channel.
7.9 Setting DARWIN F: Used to specify the flag on DC100 with the style number 7 or later, and DA100 and DR with the style number 8 or later. 1 Restrictions in equations • The specified computation equation for a computation channel No. can contain only computation channel Nos. as variable which are equal to or smaller than setting computation channel No. (Example) A02=001+A01 In this example, any computation channel No. which is equal to or greater than A03 cannot be used.
7.9 Setting DARWIN Setting Constants Constants are used for computation equation on models with computation function (/M). Up to 60 constants (K01 to K60) can be set (Thirty constants (K01 to K30) for the standalone type). The number of significant digits is 5 excluding the decimal point. If an exponent is used, the mantissa and exponent must consist of 5 digits and 2 digits, respectively. • Configurable ranges: –1.0000E+35 to –1.0000E-35 0 1.0000E-35 to 1.
7.9 Setting DARWIN ALARM If an alarm occurs, the action is executed. RELAY If the selected internal switch or relay is operating, the action is executed. When the alarm module or the DI/DO modules are not recognized as system modules, the relay is set to OFF. CHART END When the end of the chart is detected, the action is executed. FILE END When the end of file (the time when the writing operation is terminated and the file is closed) is detected, the action is executed.
7.9 Setting DARWIN RECORD (DR only) • ON: Starts recording. The recording format is set individually. For details, see “Setting the Recording Format,” on page 7-163. • OFF: Stops recording. The level action does not include record ON/OFF functions. • When the level action is set, the ON/OFF functions using the RECORD key are disabled. • The edge and level actions cannot be set simultaneously. • For the level action, only one action is available. MANUAL PR (DR only) Enables manual printing.
7.9 Setting DARWIN Note If, in the SETUP mode, the report function is set to OFF for all data items, you cannot select the action item REPORT. IM WX101-01E 7-179 1 2 3 4 5 6 7 Setting the Recorder • WR_TRIG : Saves measured/computed data on the built-in RAM disk. • RD_TRIG : Reads measured/computed data from the built-in RAM disk. • LD_TRG1-3 : Reads setup data from the built-in RAM disk. DC100 • DATA_WR : Writes the data for one scan (one data/channel) retained at the generation of an event.
7.9 Setting DARWIN Groups Setting Make Group settings for DR group trend recording or for group computation statistics, in the setting screen on the right side of the Event/Action setting screen. See an example below to enter the channel number. Example: To make channels 001, 003, 005, 006, 007, and 008 a group, enter “001,003,005-008.” Setting Timers and Summer/Winter Time The Timer function can be used to trigger a number of event/action functions.
7.
7.9 Setting DARWIN Logging Recording • Normal : Depends on the (SETUP) Recording Format settings for the Recording interval in digital printing/logging. It can be set to Single or Multiple: Single- Interval for timer one. Multiple- Intervals selected from 6 kinds of timers. • When an event occurs : Interval set as Chart Speed 2. Entering a Header HEADER LINE No. : One header can consist of up to five lines.
7.9 Setting DARWIN 1 Setting the Writing Operation (DC100 Only) Set DC100 writing operations such as the following. • Set whether to load only one file’s worth of measured data, or to continuously load multiple files’ worth. • Set whether to load data using triggers, or to load data immediately upon pressing the START key. • Select data to write.
7.9 Setting DARWIN Note If data are written using TRIG, the saving operation is also required to start using the START key or through the event/action function. Selection of Writing Data (WRITE DATA) Select the data to be written from the following: • All : All measured/computed data are written. • Alarm : Measured/computed data in all channels are written only when an alarm is generated.
7.9 Setting DARWIN Pretrigger (WRITE PRETRIG) • If WRITE TRIG is set to TRIGGER, the data before the trigger (event) generation can be saved in part of the set file. Setting is done as a percentage of the file capacity in 10% increments. • If a pretrigger is used (except 0%), it is necessary to set the writing start trigger (WR_TRIG) to the action in the event/action function.
7.9 Setting DARWIN Setting Alarm Interval, Hysteresis, and Alarm Display Hold Select a SETUP topic SETUP tab RH alarm interval RL alarm interval Hysteresis setting Alarm display hold (only DC100/DR) Alarm Interval For high/low limit on rate-of-change alarms, variation is measured over a preset interval. Hysteresis Set the width between the value of alarm occurrence and its release. Hysteresis values can be set in the 0-1% percentage range of the span.
7.9 Setting DARWIN 1 Relay (De-)Energizing Select alarm output relays to be energized or de-energized on alarm occurrence. Copy Relay (De-)Energizing settings by clicking the number of the settings you want to copy to other channels. The display color changes. Click the copy button in lower left corner of the setting screen. Click the first channel you want to copy the settings to, and drag the mouse pointer down to the last channel the settings should be copied to.
7.9 Setting DARWIN Recording Colors (for DR only) Set the colors used for DR trend recording. Report Settings Select a SETUP topic Setup tab Report type Report Starting Time Report Print ON/OFF Report Math channel settings Copy button Paste button Sort button Report Time and Format Set hourly, daily and monthly types of report making, OFF or ON. It is possible to set hourly, daily and monthly report all ON at the same time.
7.9 Setting DARWIN Report Channels and Types of computing There are sixty report channels, from R01 to R60. Assign measurement or computation channels. Select one of the Types of computing below: INST: Instantaneous value at the time of making report AVE: Average, maximum and minimum over the computing period SUM: Sum and cumulative sum over the computing period Sum : The total sum over an hour for hourly reports, the sum over a day for daily reports or the sum over a month for monthly reports.
7.9 Setting DARWIN Setting (TLOG) Math Setup, Temperature Unit, and (DC100 only) SCSI ID Number Displaying/recording in case of computation error Used to determine whether +OVER or -OVER be displayed/saved in case of computation error. Time axis scale for TLOG.SUM For TLOG.SUM of time series, data is added at each measurement interval.
7.9 Setting DARWIN SCSI ID Number (for DC100 only) Set the ID so that it does not overlap with other SCSI devices connected to the DC100. The default value is seven. 1 2 Setting FUNC Key, and SET Key Operations (for DC100, and DR only) 3 4 5 6 7 Setting the Recorder The below explanation is for the FUNC key. Set key setting works the same. Select the menu to be displayed by pressing the FUNC key whether in the FUNC menu or the FUNC3 menu.
7.9 Setting DARWIN Channel number or Tag display Select to print or display measured values using channel number labels or tag names. • Select either Channel or Tag. Note that the channel number will be printed/displayed regardless of selection, if no Tag setting is made (or all spaces). Number of Tag printing characters Select 7, 8, 9, 10, 11, 12, 13, 14, 15 or 16. • The default setting is 7.
7.9 Setting DARWIN 1 Scale check mark printing (SCALE TIC PR) For dot recording, a tic mark indicating the scale mark positions can be printed. • OFF: no mark printing. • ON: printing the tic mark. 2 Horizontal or vertical printing (LOG FORMAT) In logging mode, select either horizontal or vertical printing of the channel number/Tag.
7.9 Setting DARWIN Deleting oldest files when RAM is full (FILE ROTATE) • If saving with the division method and the saving operation is REPEAT, and if memory becomes full and so there is no file creation capacity, the saving operation is continued by deleting the file with the oldest date and time. ON : Continues saving operation by deleting a file. OFF : Terminates the saving operation.
7.9 Setting DARWIN Display Update Interval Select the display update interval when the operation display mode is set to Auto. Select 2, 3, 4, or 5 seconds. Indication for Display Select whether to have Channel Number or Tag indication on the DC100/DR display. Note that the channel number will be printed/displayed regardless of selection, if no Tag setting is made (or all spaces).
7.9 Setting DARWIN Adding and Removing Modules 4. To add a module, click the module space on a subunit. The Module Selection pulldown box opens. Select the desired module, and click “OK.” The selected module will get displayed. 5. To remove a module, again click the module you want to remove, and in the Module Selection pull-down box that appears, select “NONE.” Note • • 6. 7-196 If a unit or module gets removed, all the settings related to it, will also be reset.
7.9 Setting DARWIN 1 Changing DARWIN system configuration If necessary, change the system configuration such as the presence or absence of options to match the DARWIN that is to be configured. Changing the system configuration initializes the settings of the SET mode and SETUP mode. Perform changes in the system configuration first. The changes in options are reflected in the “Recorder List” window. 2 3 Procedure 1.
7.10 Setting CX Series The Hardware Configurator can be used to transmit and receive the setup data, change the setup data, and create new setup data for CX style number S1 to S3. If you change the system configuration and create new settings, first perform the “Changing CX System Configuration” on page 7-171. Loading Setup Data from the CX Before performing the following procedure, please make sure that the communication method and parameters are correct. (For details, see section 2.
7.10 Setting CX Series 1 Changing System Configuration You can check the following settings in this dialog box. 1. Click a number to display the setting screen. 2 3 4 5 6 7 2. Choose [System] - [System Configuration] Setting the Recorder 3. The [System Configuration] dialog box opens. 8 9 Index Type Indicates the number of channels on the CX. Channel Indicates the number of channels on the CX. [0CH] (when the style is Style 2 or later) or [6CH] on the CX1000.
7.10 Setting CX Series Style Indicates the CX style number. Depending on the style number, a version (example: Version 3.02 or later) check box appears to the right. Math Function Indicates whether math functions are available. Serial Indicates the serial communications mode: [OFF], [RS-232], or [RS-422/485]. Media Indicates the external storage media: [FDD], [ATA], or [ZIP]. Alarm Relay Indicates the type of alarm relay: [NONE], [4p+With Fail/Mem. End], [6p], or [External Loop].
7.10 Setting CX Series 1 Control Function Basic Settings Make the basic settings of control function. To do so, click the [Setup] tab then select the settings you wish to enter from the list that appears on the left of the screen. Or, you can select the items by choosing [Control Settings] - [Setup Mode]. Control Action 2 3 4 5 6 PID Number Set between 1 and 8. If the number is changed, the program pattern for the program control option will be initialized. Set to [250ms], [500ms], or [1s].
7.10 Setting CX Series CLOG Error (CX Style Number S3 or Later) Set the error handling when the channel data for CLOG, which is an operator for PV/SP math and retransmission, is in error. Error:Handle as a computation error Skip: Skip the erroneous data and compute Event output setting On Style 3 Ver. 3.02 or later, event output can be set for each program pattern. To set the event output for each program patter, select [Separate]. To set the event output for all program patterns, select [Common].
7.10 Setting CX Series • AUX Remote Setting When performing measurements by remote, select [Remote]. When [Control Mode] is set to [Cascade], it is not possible to set [Remote] for secondary measurement loop numbers. Selection is not possible for the following: • Secondary measurement loop numbers when [Control Mode] is set to [Cascade]. • Even-numbered loops when the number of loops is 2, 4, or 6 (6/4LOOP Select is set to 4) and [Control Mode] is set to [PVSwitch] (when PV/SP math function is OFF).
7.10 Setting CX Series [Burnout/Tuning] Tab • Input Process Burnout For the measurement input to each loop, select the burnout direction (open-circuit detection) from [OFF], [UP], or [DOWN]. The [No.2] setting is valid when [Control Mode] is set to [PVSwitching], and the [Remote] setting is valid when remote input is used as measurement input. This setting is invalid for measurement inputs other than thermocouple and unified signals.
7.10 Setting CX Series 1 Contact Input 2 3 4 Module Setting Select the terminal blocks where you want to register contact inputs from [CTRL3-4] for a CX2000 with 4 loops or more, [CTRL5-6] for a CX2000 with 6 loops or more, or [EXTDIO] for a CX2000 with External DIO selected for Alarm Relay. 5 Contact For each contact input number, select the type of contact input from the following. Some items may not be selectable depending on the system configuration and control mode.
7.10 Setting CX Series SP No. Selection Source When specifying input contacts of SP No. settings, select the loop number of the SP Number set to be switched. Activate or deactivate each loop number (CX1000: LOOP01 and LOOP02, CX2000: LOOP01 to LOOP06 (up to 4 loops when 6/4LOOP Select is set to 4)). Pattern Number Selection (When [Program Control] for [Internal Loop] is ON) With program control, you can select the range of pattern numbers when switching program patterns through contact input.
7.10 Setting CX Series 1 Control Relay 2 3 4 Module Setting Select the terminal blocks where you want to register contact inputs from [CTRL1-2], [CTRL3-4], [CTRL5-6], or [EXTDIO]. [CTRL3-4], [CTRL5-6], and [EXTDIO] are available only for the CX2000. FAIL Activates the output of a relay contact signal (FAIL signal) if a fault occurs in the CX CPU. When it is [ON] (default: [OFF]), contact output number [DO001] of control output terminal block 1 is automatically assigned to [De_energize/Nonhold].
7.10 Setting CX Series External Loop For each loop there are Basic Setting, External Loop Setting, Parameter Address Setting, and Tuning Setting items. [Basic Setting] Tab • Control Action Comm. On/Off Select to turn the external loop function (the Green Series communications function which allows the CX to communicate with loop controllers) ON or OFF. If you select OFF, all settings below will be deactivated.
7.10 Setting CX Series 1 Tag Specify a tag using a maximum of 8 characters. Tag Comment Specify a tag comment using a maximum of 8 alphanumeric characters. 2 PV/SP/OUT Set the decimal place and units of PV, SP, and OUT. 3 Control Span Set the control span between the upper and lower limits. Control Mode Select the control mode from the following (The available control modes differ depending on the connected instrument.
7.10 Setting CX Series [Tuning Setting] Tab • Tuning Setting (External) Tuning item ON/OFF Select [On] for the parameters that you want to display in the tuning window, and [Off] for other parameters.
7.10 Setting CX Series 1 Control Function General Settings Make settings for the internal loop control functions, using the [Control Loop] tab and [Control Group] on the [Setting] tab. You can also enter these settings by choosing [Control Setting] - [SETUP [Regular] Setting] - [Control Loop], or [Control Settings] - [SETUP [Regular] Setting] - [Control Group]. On the [Control Loop] tab, click the button (LOOP01, LOOP02, ...
7.10 Setting CX Series Range/Type (PV1, PV2, Remote) Select the voltage range, thermocouple, and resistive temperature detector type. VOLT: 20mV, 60mV, 200mV, 2V, 6V, 20V, or 50V TC: TypeK, TypeJ, TypeT, TypeB, TypeS, TypeR, TypeN, TypeE, TypeL, TypeU, TypeW, PLATINEL, PR40-20, or WRe3-25 RTD: JPt100 or Pt100 When [SCALE/1.5V] is set to [1.5V], [Range/Type] is set to [6V]. Span (PV1, PV2, Remote) Specify the measurement span in EU. Scale (PV1, PV2, Remote) Specify the scale between –30000 and 30000.
7.10 Setting CX Series 1 When the PV/SP Math Function Is ON 2 3 4 Enter PV or SP settings. If the control mode is set to Retransmission, a menu for entering retransmission settings appears. See the next page. PV/SP Math Function Select the item you wish to set, PV, PV1, PV2, or SP. If the control mode is set to Basic or Cascade, set PV. If the mode is set to PVswitch, set PV1 and PV2. You can select SP when [Internal loop] > [Remote setting] under the [Setup] tab is ON.
7.10 Setting CX Series PV Switch (PV1) Set the values within the PV range. Set the decimal point position (0 to 4), upper limit (U), and lower limit (L). If [Method] is set to [TCRange] in the [Control Setting] of the [Internal loop] item under the [Setup] tab, set the upper limit (U) and lower limit (L). If [Method] is set to [PVHigh], set only the upper limit. If [Method] is set to [Signal], the PV Switch setting is not available. You can set this item even when the mode is OFF.
7.10 Setting CX Series Output Span Set the maximum value, minimum value, decimal point position (0 to 4), and unit (up to 6 alphanumeric characters). Set the maximum and minimum values between –30000 to 30000. The maximum value must be greater than the minimum value and the difference between the two must be less than or equal to 30000. Math Error Set whether to set the value to overrange value or underrange value when the computed result is in error.
7.10 Setting CX Series • PID Parameters Specify the PID parameters for each loop. Target setpoint Specify the target setpoint in EU (0.0 to 100.0%). Set between the target setpoint’s upper and lower limits. Alarm value (1 to 4) Set the alarm value. (The setting depends on the type of alarm.) PV and SP alarms EU (0 to 100%) Deviation-High and Deviation-Low alarms EUS (–100 to 100%) Deviation alarms EUS (0 to 100%) Output alarms –5.0 to 105.0% Proportional band (P) Specify between 0.1 and 999.9%.
7.10 Setting CX Series 1 Operation Related 2 3 4 5 • Operation Related Make the internal loop control operation related settings. 6 Suppressing Function Select [OFF] or [Overshoot]. Ramp-rate Time Unit Set the ramp-rate time units. 7 Tag Specify a tag. Use a maximum of 8 characters. Setting the Recorder SP Ramp-down-rate Set between 1 digit and EUS (100%). Tag Comment Specify a comment for the tag. Use a maximum of 8 characters. Index 8 SP Ramp-up-rate Set between 1 digit and EUS (100%).
7.10 Setting CX Series Reference Deviation Turn the reference deviation on or off, and specify the value with the measurement input span one-digit EUS (100.0%). With style number S1 (system setting), it is not displayed if the PID number is 1. With style # S2, it is not displayed when the PID number is 2 or less. Linearize Mode Select the linearize mode from [OFF], [Biasing], or [Approximation]. Input Enter the linearize input value. (The value depends on the linearize mode.
7.10 Setting CX Series 1 Control Function Settings 2 3 SP Tracking Turn the target setpoint tracking ON or OFF. 4 PV Tracking Turn the measurement value tracking ON or OFF. Target Setpoint Limiter Set the value in the measurement span EU (0.0 to 100.0%). L must be smaller than U. Output Velocity Lim Select or clear the check box to turn the output velocity limiter ON or OFF, and specify a value between 0.1 and 100.0.
7.10 Setting CX Series KIND Select the loops numbers, measurement channel numbers, or DIO numbers (Style 3 or later) you want to assign to a Group. For the CX1000, you can select 1 or 2 internal loops and 1 to 4 external loops. For the CX2000, you can select 1 to 6 internal loops, 1 to 16 external loops, and 1 to 36 DIOs. Group1 consists of up to 4 types on the CX1000, or up to 6 types on the CX2000 corresponding to the control loops and measurement channels.
7.10 Setting CX Series DO Num Set the DO that is to perform DIO monitor. If the DIO Kind is set to DO-2, DIO12, DO2P, or DIO-12P, set a separate DO for ON and OFF. The DO numbers cannot overlap including those of other DIO entry numbers. This does not appear when DIO Kind is DI-1. 1 2 DI Num Set the DI number to be monitored. 3 Tag Set the tag. Enter up to eight alphanumeric characters. 4 TagComment Set the tag comment. Enter up to eight alphanumeric characters.
7.10 Setting CX Series Control Input (CX Style Number S3 or Later) When PV/SP math is ON, set [Input Range] and [Linearizer] for each channel. [Input Range] tab • Scale/1-5V Set the measurement mode of the channel to [Temp], [Scale], or [1-5V]. • Mode Set the channel input mode to [VOLT], [TC], or [RTD]. If [Scale/1-5V] is set to [1-5V], the mode is fixed to [VOLT]. • Range/Type Select the voltage range or the thermocouple or RTD type.
7.10 Setting CX Series 1 • Filter (PV1/2 or Remote) Turns ON/OFF the use of the filter. When it is ON, set the value between 1 and 120 s. 2 [Linearizer] Tab 3 4 5 6 • Mode Set the mode to [OFF], [Biasing], or [Approximation]. • Output Set the linearizer output value. (The value varies depending on the mode.) Biasing: Set the value in EUS (–100.0 to 100.0) of the measurement span. Approximation: Set the value in EU (–5.0 to 105.0%) of the measurement span.
7.10 Setting CX Series Control Channel Settings (Internal/External) The following settings apply to the internal and external loops’ SP, PV, and OUT measurement displays. To enter control channel settings, click the [Control(Int)] tab. Or, you can select the items by choosing [Control Setting] - [SET [Basic] Setting] - [Control Channels (Internal)]. Tag Enter a tag of using maximum of 16 characters. You can enter a tag to be displayed on the screen instead of the channel number.
7.10 Setting CX Series 1 Partial Expand(%) The boundary value is displayed as a percentage along the width of the display, between 1 and 99%. 2 Boundary The setting conditions depend on the internal control channel and external control channel as follows: • Internal control channel PV/SP: EU (0%) < boundary value < EU (100%) OUT: EU (–5.0%) < boundary value < EU (105.
7.10 Setting CX Series Program Control Related Setup Operations Turn ON/OFF Program Control Program control can be turned ON and OFF using the internal loop setting of the control function basic settings. Click the Setup tab then select [Internal Loop] from the list that appears on the left of the screen. Or, you can select the items by choosing Control Settings > Setup[Basic] Setting > Internal Loop.
7.10 Setting CX Series Initial Program Patterns You can set the default program patterns by clicking the [Program pattern] tab, then selecting [Default setting]. Settings cannot be entered when the number of segments is 0. Add segments using [Segment setting]. Set the start code Available when segments have been inserted or added under [Segment setting]. Set the start setpoint Available when segments have been inserted or added under [Segment setting].
7.10 Setting CX Series Start target setpoint Set the start SP, a starting condition, in the range of [EU (0.0% to 100.0%)] (initial value is 0%) of the measurement span. On Style 3 or later, the value can be set on the loop whose Action Loop Set is ON. On Style 2 or earlier, the value can be set on loops whose [Program Control] has been turned ON in [Internal Loop] under the [Setup] tab. During cascade control, even-numbered loops within the same terminal block cannot be set.
7.10 Setting CX Series 1 Program Pattern Setting (Segment setting) Set a program pattern for each segment, by clicking the [Program pattern] tab, then selecting [Segment settings].
7.10 Setting CX Series • Ramp/Soak select Select the type of segment to be specified ([Ramp] or [Soak]). • Target setpoint (ramp segment only) Set the final SP of the ramp segment in the range of “EU (0.0% to 100.0%)” (initial value is 0%) of the measurement span. On Style 3 or later, the value can be set on the loop whose Action Loop Set is ON.
7.10 Setting CX Series • Wait action Set the wait action type to [Shift] or [Within]. To disable the wait action, select [Off]. • Wait zone number Select the wait zone number from [1] to [5]. This item is available only when [Wait action] is set to [Shift] or [Within]. PV Event 2 3 Set the PV Event. Click this tab 1 PV event display 4 5 6 7 • Type Select the type of PV event from the following.
7.10 Setting CX Series Time Event Set the Time Event. Click this tab Time even display • On1/On2/On3/Off Set the ON/OFF setting type of each event (16 events) from the following. Select [Off] for events that are not to be assigned. Select [Off] (initial setting) for the number of the loops to which the event is not to be assigned. On1: Use On time and Off time On2: Use On time only On3: Use Off time only • On-time/Off-time Set the ON-time/OFF-time of the time event in “hh:mm:ss” format.
7.10 Setting CX Series Repeat Set the repeat action. The repeat start segment, repeat end segment, and repeat frequency is displayed in the program display screen. Click this tab Start segment for repeat Number of End segment repetitions for repeat Segment number 1 2 3 4 5 6 Repeat action Repeat frequency Repeat start segment 7 Repeat end segment • Repeat frequency Set the number of repetitions when the repeat function is turned ON in the range of [1] to [999].
7.10 Setting CX Series PV Event (CX Style Number S3 or Later) Set the PV event hysteresis in the range of [0.0] to [10.0]. On Style 2 or earlier, the value is set from the setup menu of the [Setting] tab.
7.10 Setting CX Series PV Event-Relay output, Time Event-Relay output, and Program pattern end signal • Output Turn OFF/ON the control relay output. 1 2 • Number Select the number of the relay output terminal from the following. DO001 to 006, DO101 to 106, DO201 to 206, RO001 to 012 (on models with the expansion DIO terminal block) 3 • Action Displays the relay output action (energized or de-energized) according to the [Control Relay] settings under the [Setup] tab.
7.10 Setting CX Series AUX (Automatic Message, Display Position) Turn message display ON/OFF, and set the loop display position on the CX.
7.10 Setting CX Series 1 Basic Measurement Function Basic Settings To enter measurement function basic settings, click the [Setup] tab. Or, you can select the items by choosing [Setting] - [SETUP [Basic] Setting] - [Setting]. Alarm/Relay/Remote 2. Click here. (Or choose the [Setting] menu - [SETUP [Basic] Setting] - [Setting].) 1. Select this tab. 2 3 4 Select between 1 and 15. Copy/Paste the selected range. 5 6 7 8 Alarm/Relay Select the alarm format. The selected items are blue.
7.10 Setting CX Series • Rate of Change Increase Select the number of data samples that determines the interval of the rate of change of an upper limit alarm between [1] and [15]. • Rate of Change Decrease Select the number of data samples that determines the interval of the rate of change of an lower limit alarm between [1] and [15]. • Alarm Hysteresis Set the alarm hysteresis to [ON] or [OFF]. When it is [ON], the hysteresis is set to 0.5% of the scale or the measurement span.
7.10 Setting CX Series Memory Sample (save method of measured/computed data) • Save Select the save method of internal memory data to an external storage media from [Auto] or [Manual]. Manual: Inserting the external storage media into the drive and closing the cover displays the “Save confirmation” message, allowing data to be saved. When the operation is complete, remove the external storage media from the drive, so that the next set of data save operation can be performed.
7.10 Setting CX Series Memory Timeup When the [Save] is set to [Auto] in [Memory Save], specify the date and time of the save operation. • Timeup type Select the type of save interval from [Hour], [Day], [Week], or [Month]. When you are not using this function, select [OFF]. • Day of the week/Date When [Timeup type] is [Week], select a day. When [Timeup type] is [Month], specify the date, between 1 and 28. It is not possible to specify dates 29 to 31.
7.10 Setting CX Series Copying and Pasting Setup Data You can copy the setup data of one channel or more to other channels. Use the following procedure to copy and paste. 1. 2. 3. 4. Click the source channel number that you want to copy. To select many channels, click the first source channel, then drag over all the channels that you want to copy. Click the [Copy] button at the bottom of the window. Click the destination channel number.
7.10 Setting CX Series • User ID Specify whether you want to use a user ID when logging in. When selected, you can specify user ID. User Setting List • User name Use up to 16 characters for the user name. • User ID Up to 4 characters can be entered for the User ID. [???] is displayed after the password is entered. • Password Up to 6 characters can be entered for the password. [???] is displayed after the password is entered.
7.10 Setting CX Series Report (Creating Hourly/Daily/Weekly/Monthly Reports, Setting Available when the Computation Function Option is Active.) 1 Click here. (Or choose the [Setting] menu - [SETUP [Basic] Setting] - [Setting].) 2 Set the date and time at which to create the report. 3 4 5 Select the channel to figure on report. Enable (ON) or disable (OFF) the report channel settings. 6 Note You cannot set the RefCh to a measurement channel on models with 0 measurement channels.
7.10 Setting CX Series Copying and Pasting Setup Data You can copy the setup data of one channel or more to other channels. Use the following procedure to copy and paste. 1. 2. 3. 4. Click the source channel number that you want to copy. To select many channels, click the first source channel, then drag over all the channels that you want to copy. Click the [Copy] button at the bottom of the window. Click the destination channel number.
7.10 Setting CX Series 1 Temperature Unit Set the temperature unit from [C](Celsius) or [F](Fahrenheit). 1. Click here. (Or choose the [Setting] menu - [SETUP [Basic] Setting] - [Comm].) 2 3 4 5 Time Zone Set the difference in time from the GMT. For example, with Japanese time this is normally +9:00. 1. Click here. (Or choose the [Setting] menu - [SETUP [Basic] Setting] - [Comm].
7.10 Setting CX Series Measurement Channels Settings To enter measurement channel settings, click the [Meas] tab. Or, you can select the items by choosing [Setting] - [SET [Regular] Setting] - [Meas Channels]. Measurement channels cannot be assigned on 0 measurement channel models. The Meas tab and the measurement channels in the Setting menu are not displayed. Click this tab. Double-click to set the channel. Select the input mode. Difference computation Scale Square root Select the range/type.
7.10 Setting CX Series 1 Input Type (Mode and Range/Type) Select from the pull-down list.
7.10 Setting CX Series Alarm Four alarms (Alarm 1 to 4) can be specified on each channel. Type Select H, L, h (dH), l (dL), R (RH), r(RL) T, or t. T or t is selectable when the style number is greater than or equal to 2. The selectable alarms vary depending on the input mode and computation type. For details, see section 7.2 of the CX User’s Manual (IM 04L31A01-01E or IM 04L31A01-03E). Value Alarm is generated using the specified value as the boundary.
7.10 Setting CX Series 1 Graph Divisions Select the number of bar graph divisions. 2 Bar graph Select the reference position of the bar graph. Selecting [Center] when the bar graph is vertical produces no effect. It is set back to [Normal] when the data is checked. 3 Scale When using scale display on the trend screen, select the scale display position. 4 Partial Expand (%) Set the boundary for the partial expanded display. The range is 1 to 99%.
7.10 Setting CX Series Copying and Pasting Setup Data You can copy the setup data of one channel or more to other channels. Use the following procedure to copy and paste. 1. Click the source channel number that you want to copy. To select many channels, click the first source channel, then drag over all the channels that you want to copy. 2. Click the [Copy] button at the bottom of the window. 3. Click the destination channel number.
7.10 Setting CX Series 1 Computation Channel Settings To enter computation channel settings, click the [Math] tab. Or, you can choose [Setting] - [SET [Regular] Setting] - [Math Functions]. Measurement channels cannot be used in expressions on 0 measurement channel models. Double-click to set the channel. Click this tab. Turn ON/OFF the computation. Specify on expression. Set the display span (6 characters or less). Specify the unit. Specify the constant to be used in the expression.
7.10 Setting CX Series Alarm and Tag The settings are the same as the measurement channels. For details, “Measurement Channels Settings” (page 7-220). TLOG Computation Timer Select one of the timers (1 to 3) set in the setup mode. The computation interval of TLOG computation is set to the time assigned to the selected timer. Sum Scale Set the sum scale. Rolling Average Rolling Average Computation ON/OFF Select whether to compute the rolling average.
7.10 Setting CX Series 1 Setting One Computation Channel at a Time 2. Click the tab of the item to be set. Click here to enter the operator. 2 1. Double-click the channel to set to open the Channel Settings dialog box 3 4 5 6 3. After setting the items, click here. Set the maximum value. Set the minimum value. Setting the Recorder Copy the first setting. 7 [Select Operator] dialog box 8 Select the operator type and click the operator button.
7.10 Setting CX Series Copying and Pasting Setup Data You can copy the setup data of one channel or more to other channels. Use the following procedure to copy and paste. 1. Click the source channel number that you want to copy. To select many channels, click the first source channel, then drag over all the channels that you want to copy. 2. Click the [Copy] button at the bottom of the window. 3. Click the destination channel number.
7.10 Setting CX Series 1 Display Settings To enter display settings, click the [Setting] tab. Or, you can select the items by choosing [Setting] - [SET [Regular] Setting] - [Display Setting]. 2 Display Select the time per division. Select the display format. Click this tab.
7.10 Setting CX Series Message/File Click here. (Or choose the [Setting] menu - [SET [Regular] Setting].) Specify a message. Copy the message. Paste as another message number. Specify a comment. Specify a save destination folder. Message Use up to 16 characters can be entered for the message. File Header Add a comment to the header section of the measurement/computation data file. Directory Name Specify the name of the folder where measurement/computation data files are saved.
7.10 Setting CX Series Group/Trip Line Click here. (Or choose the [Setting] menu - [SET [Regular] Setting].) Click the tab of the group to be configured. Specify a group name. Turn ON/OFF the trip line display Set the trip line value by dragging the slider. Set the trip line by specifying a value. 1 2 3 4 5 Select the channels that you want to register in the selected group (blue: ON). 6 Select the color of the trip line. Group Name 7 Use up to 16 characters can be entered for the group name.
7.10 Setting CX Series View Group (only for CX2000) Click here. (Or choose the [Setting] menu - [SET [Regular] Setting].) Specify a view group name Select or drag from the right the type of screen to be displayed. Type of screens available. Select the group to be displayed. View Groups Up to four view groups can be registered. Group Name Use up to 16 characters can be entered for the group name. The group name appears as a sub menu of the [4 PANEL] display of the CX2000.
7.10 Setting CX Series 1 User Key/Daylight Saving Click one. (Or choose the [Setting] menu - [SET [Regular] Setting].) Select the function to be assigned to the User Key. Set the time at the daylight saving time adjustment is to be enabled/disabled. 2 3 4 5 6 For details about the User Key settings, refer to the CX User’s Manual (IM 04L31A0101E or IM 04L31A01-03E). 7 Batch header Setting the Recorder Set the header information when the optional batch header is enabled.
7.10 Setting CX Series Network Settings To make network settings, click the [Setup] tab, then select the [Network] from the list on the left. It is also possible to select the item in [SETUP [Basic] Setting] on the [Setting] menu. TCP/IP Settings Connect the CX to the Ethernet and, in the dialog box below, enter TCP/IP settings. Type the same address for [IP Address] as the one of the [Address] box of the [Network Settings] dialog box. 1. Click here.
7.10 Setting CX Series Modbus Master Settings When using the CX as a Modbus master, enter the Modbus master basic and command settings. For details about the settings, refer to the CX Communication Interface User’s Manual (IM 04L31A01-17E). Click this tab 1 2 3 4 5 6 FTP Settings 2. Click the [Primary] or [Secondary] tab. 1. Click this tab. 7 Setting the Recorder Using the FTP function, measurement/calculation data can be automatically transferred from the CX to the specified server as files.
7.10 Setting CX Series Web Server Settings When using Ethernet communications, the CX can be set up as a web server. Set [Web Server] to [ON], and then set the access certification for the operator page and monitor page. Click this tab E-mail Transmission Settings When using e-mail transmission, specify [SMTP server name], [Port number], [Recipient1], etc. For details about the settings, refer to the CX Communication Interface User’s Manual (IM 04L31A01-17E).
7.10 Setting CX Series Aux Set the handling of the DO and internal switch when the communication buffer recovers and the auto recovery of the communication with the Modbus master and Green Series controller. These items are valid when serial communication is installed. Click this tab 1 2 3 4 5 6 7 Setup Data Adjustment Setting the Recorder 1. Click here. (Or choose the [System] menu - [Data Adjustment].) 8 9 2. If the data is not consistent, the following dialog box opens.
7.11 Writing Setting Parameters to the Recorder When you have finished setting the recorder, write the setting parameters back to the recorder. Procedure 1. In the “DAQLOGGER Hardware Configurator” window, select “Communication” then “Send.” The “Select Recorders” dialog box appears. 2. Select the recorders to send data to and then click the “Send” button. • To select all the recorders Click “Select All.
7.11 Writing Setting Parameters to the Recorder 3. When the setting parameters have been sent, a “Communication Message” dialog box appears. Read the message and click “OK.” 1 2 3 4 5 Note • • • • • • • • • • • IM WX101-01E 7-265 6 7 Setting the Recorder • Communication is not possible of the scanning or the recording is in progress. With the VR series, the settings data of “SETUP” cannot be sent to the recorder.
7.12 Initializing the Setup Parameters The setup parameters of the SET mode and SETUP mode are reset using the specified system configuration or subunit/module configuration (for DARWIN). Procedure 1. 7-266 With the “Setting” window of the recorder to be initialized open, select “Initialize” from the “Setting” menu. A message confirming the initialization is displayed. Click “OK.
1 7.13 Handling Setting Data Using a Floppy Disk Importing Files 2 The setup parameters on the floppy disk are loaded. For VR, this function is used because the setup parameters of SETUP mode cannot be transmitted via communications. It is also used to edit the settings of VR and DARWIN that do not have the communication option on the DAQLOGGER Hardware Configurator. This function can also be used on DX, MV, CX and DARWIN with communication functions. DA and µR are not applicable.
7.13 Handling Setting Data Using a Floppy Disk For DR, DC Procedure 1. Load data from the settings file created by the recorder. In the menu bar of the “DAQLOGGER Hardware Configurator” window, select “File”“File Import.” The “Open File” dialog box appears. (File names) 2. Checkmark the “Overwrite” (Overwrite function, see below) if you want to overwrite the file currently being edited, without changing system configurations.
7.13 Handling Setting Data Using a Floppy Disk 3 If you click “Open” the data will be downloaded. If the setting data which are at that time being edited aren’t saved yet, you will be asked whether to save them or not. A warning will be displayed, if all data can’t be loaded. 1 2 Note When data were acquired with the DC100, a message may appear warning you that some changes have taken place. In that case, please check if all data have been acquired.
7.13 Handling Setting Data Using a Floppy Disk DR, DC (File names) “Comment” is void. 2. 3. 7-270 Save the data under a specified file name. The file extension will be set automatically. Load the file to the recorder by using the recorder’s settings reading function.
1 7.14 Saving the Settings Save the settings data. The settings will be saved under a file name in the following format to the project folder. For example, the file name will be “Project1.r01” when the project name is “Project1” and recorder number is “1.” Procedure 1. In the “DAQLOGGER Hardware Configurator” window, select “File” then “Save” or “All Save.” • “Save”: Saves data of the active settings window. • “All Save”: Saves data of all the settings windows which are opened.
7.15 Printing the Settings Operations of “Print,” “Print Preview,” and “Set Printer” under the “File” menu of “DAQLOGGER Hardware Configurator” window are the same as those of Windows’ print commands. Procedure Print Previewing 1. In the “DAQLOGGER Hardware Configurator” window, select “File” then “Print Preview.” The “Print Preview” dialog box appears. Printing 1. In the “DAQLOGGER Hardware Configurator” window, select “File” then “Print.” The “Select Recorders” dialog box appears. 2.
1 7.16 Transmitting Control Commands to the Recorder 2 3 4 5 6 7 Setting the Recorder The following control commands can be transmitted to a recorder that can communicate from the “DAQLOGGER Hardware Configurator” window. The commands that can be transmitted and their contents vary depending on the series or model. • Date and time : All recorders. Sets the date and time of the recorder to the date and time of the PC. • Start/Stop recording : All recorders except VR and DA.
7.16 Transmitting Control Commands to the Recorder 3. From the command item list in the left part, click the control command to display its settings dialog box. 4. Set for the control command.
7.16 Transmitting Control Commands to the Recorder 1 “Display” command differs from recorder models as follows. VR200 S2 µR1000/µR1800 2 3 DX100/MV100/CX1000 DX200/DX200C/MV200/CX2000 4 5 DR130/DR200 6 DC100 7 Note • • • • • With models other than VR206 and VR106, sending any non-standard display will cause an error. When manual display is selected with the µR series, you can select channels which do not exist in the connected recorder.
7.16 Transmitting Control Commands to the Recorder Reconstruct For DA, DR200 ( expandable models), and DC only. 5. When you have finished setting commands, press the “Send” button. When the commands have been sent, a “Communication Message” dialog box appears. 6. 7-276 Read the message and click “OK.
7.17 Starting/Stopping the DARWIN Report Function and Executing Balancing On DARWIN, you can start or stop the report function and executing balancing of strain input. 1 2 Starting/Stopping the DARWIN Report Function 3 This is valid on DARWIN with the report function. Procedure 1. 2. In the “Recorder List” window, click the “Number” cell of the recorder on which to start or stop the report function to display the “Settings” window. Select “Action” - “Report” from the “Communication” menu.
Chapter 8 8.1 Using DAQLOGGER Client Package Starting the Remote Monitor/Connecting to the Server Remote Monitor receives data from the server (host) on the network and displays the data in the following six types of monitor screens: alarm, trend, color graph, numeric, meter, and circular. The monitor server must be running on the server side. For a description on how to use each monitor, see section 8.2. 1 2 3 Starting the Remote Monitor Procedure 1.
8.1 Starting the Remote Monitor/Connecting to the Server 3. 4. Click each item box and enter the value. Server Host: The name of the server. Port No.: The port number to use. This value must match that of the server. The default value is 50280. System No.: You do not need to set this value. It is fixed to 0. Step: Specify the interval at which to receive the data from the server in terms of data points (the server transfers scan data). The default step value is 1.
8.1 Starting the Remote Monitor/Connecting to the Server 1 Connect to a server by opening the connection settings file 1. Select “Open” from the “File” menu. The “Open” dialog box opens. 2 3 4 2. 3. Select a file and click “Open.” The dialog box closes and the “Trend” monitor window is displayed. Click “Connect/Disconnect” on the toolbar or select “Connect” from the “File” menu. A connection is made to the server, and data are displayed on the monitor window. 6 Connecting to another server 1.
8.1 Starting the Remote Monitor/Connecting to the Server Disconnecting from the Server/Closing the Connection Settings Procedure Disconnecting from the server 1. 2. Click the monitor window you wish to disconnect so that it is displayed in front. Click “Connect/Disconnect” on the toolbar or select “Disconnect” from the “File” menu. A confirmation dialog box appears. Click “OK.” The communication with the server is disconnected.
8.2 1 Monitoring the Data Displaying the Monitor Window The monitor window is displayed within the remote monitor window. The contents of the menu bar of the remote monitor vary depending on the selected monitor window. The toolbar displays all the tool buttons. However, only the buttons related to the selected monitor window can be used. 2 3 Procedure 1.
8.2 Monitoring the Data Alarm Monitor For the operation procedure, see the sections indicated below. • “Alarm Monitor” in section 3.3. • “Displaying cursor’s values with the Alarm Log display” in section 3.4. However, you cannot check the alarms (Note in page 3-17). Overview display Displays the alarm conditions by groups.
8.
8.2 Monitoring the Data Trend Monitor For the operating procedure, see “Changes Common to Monitor Windows” and “Trend Monitor” in section 3.3, “Changing the Display Settings of Monitor Windows.” For operations using the cursor, see section 3.4, “Using the Cursors.” For details on general display settings, see “Setting the Display Conditions” in this section (page 8-13). However, the following operations are different. Switching tag number/name display 1. To display tag numbers, select “Tag No.
8.2 Monitoring the Data 1 Color Graph Monitor For the operating procedure, see “Color Graph Monitor” in section 3.3, “Changing the Display Settings of Monitor Windows.” For operations using the cursor, see section 3.4, “Using the Cursors.” For details on general display settings, see “Setting the Display Conditions” in this section (page 8-13).
8.2 Monitoring the Data Numeric Monitor For details on general display settings, see “Setting the Display Conditions” in this section (page 8-13).
8.2 Monitoring the Data 1 Circular Monitor Displays the data over an hour to four weeks on a circular graph. On the circular graph, the radius corresponds to the Y-axis of the trend display and the circumference corresponds to the time axis.
8.2 Monitoring the Data Procedure Setting the Time Axis • Selecting the displayed time 1. Click the “Time-Axis” menu. 2. Select the displayed time per cycle. Note The number of displayed data points for a single waveform is 1800. The time over which the measured data can be monitored on the circular screen depends on the scan interval and the step value (P. 8-1).
8.2 Monitoring the Data 1 Setting the Display Conditions Set up to 32 tags per group and register up to 50 groups. 1. Click “General Display Settings” on the toolbar or select “General Display Settings” from the “File” menu. The “General Display Settings” dialog box opens. Click the tab of the group to be configured The waveform corresponding to the waveform No.
8.2 Monitoring the Data Saving the Display Conditions The display conditions that have been changed are saved when the connection settings are saved. See “Saving the connection settings” (page 8-2).
8.3 1 Using the Historical Viewer The Viewer displays the data that have been recorded by the logging software as a waveform or values. You can also view the data that have been created by the report function. The Viewer window can display the following data files. 3 • Data file that has been recorded by the logging software (extension: .mld) • Report binary file that has been created by the Report Generator (extension: .rbi).
8.4 Using the File Utility The File Utility performs four functions, Link, Divide, Convert, and Restructure, on the data file or report file that the DAQLOGGER creates. The File Utility that is provided in the client package is started from the Start menu of Windows. The operating procedure of the File Utility is the same as the DAQLOGGER File Utility. Starting the File Utility Procedure 1. From the Start menu, select Programs > YOKOGAWA DAQWORX > DAQLOGGER Client > File Utility. The File Utility starts.
8.5 1 Using the Remote Controller The following remote control operations can be performed via Ethernet. • Start/stop scan on the logger software. • Start/stop recording. • Start/stop the Event Processor. • Execute events on the Event Processor manually. To use the remote control functions, you must first enter control server settings on the DAQLOGGER Manager. 2 3 4 Using the Remote Control Software Procedure 1.
Chapter 9 Error Messages and Their Corrective Actions 9.1 1 Error Messages and Their Corrective Actions Messages are displayed under some situations when using the DAQLOGGER or DAQLOGGER Client Package. The following list shows the meanings of the messages and explains what to do when they are displayed. 2 Common Error Code E0002 Error message Insufficient memory. Please exit at once. E0003 Cannot open shared memory. E0101 Please open from the DAQLOGGER manager. E0211 Cannot write to file.
9.1 Error Messages and Their Corrective Actions Logger Software Error Code E3001 Error message Failed to open data file. E3002 Failed to write data file. E3003 Failed to open alarm log. E3004 Failed to write alarm log. E3005 E3006 Tag is not specified. Please specify tag first. Connection failure for all devices. E3007 No available monitor server exists or No monitor server which is logging data exists. E3008 No available device exists.
9.1 Error Messages and Their Corrective Actions 1 Software Configurator Warning Code W3331 W3332 W3333 Warning message The µR1000 and µR1800 cannot be distinguished automatically. Please select the correct recorder model. The recorder model can’t be recognized. It will be regarded as not connected. The VR100 and VR200 cannot be distinguished automatically. Please select the correct recorder model. What to do Select µR1800 or µR1000 manually. 2 Check the model of the connected recorder.
9.1 Error Messages and Their Corrective Actions Warning Code W3431 Warning message Memory may be initialized. Continue sending data? W3433 This file does not fit settings made with DAQLOGGER Software Configurator. Continue? This setting is initialized. OK? System configuration is changed. Setting is initialized. OK? Hardware and software configurations don't match. Continue to send? Hardware model doesn't match software setting. Continue sending? Hardware and Software configurations don't match.
9.1 Error Messages and Their Corrective Actions 1 DAQLOGGER Manager Error Code E3503 Error message Password was confirmed incorrectly. E3504 E3505 Invalid password. Cannot exit DAQLOGGER Manager while scanning/recording is in progress. Cannot contain any of the following characters: \ / : , ; * ? “ <>| File name is too long. Cannot exit DAQLOGGER Manager while Desktop protection is active. Cannot exit DAQLOGGER Manager while Password protection is active.
9.1 Error Messages and Their Corrective Actions Event Processor Error Code E3701 Error message Illegal event processor settings. E3702 Invalid character. What to do Check the event settings. This error occurs when no events are specified, for example. Check the character string that you have entered. Commas “,” cannot be used. Message Code M3761 M3762 M3763 Message Delete current event? Overwrite saved event? Current event not complete. Check the settings.
9.1 Error Messages and Their Corrective Actions 1 Remote Controller Error Code E3901 Warning message Login failure. What to do Confirm whether the control server is running. Check whether the host name, port number, and password are correct. Warning Code W3932 Warning message Manager software is working. 2 3 What to do If any Manager software dialog boxes appear, close them. 4 Monitor Server Error Code E4101 Warning message Port No. is already in use. What to do Change the port number.
Index 1 Index Symbols +OVER.................................................................................. 4-24 –OVER.................................................................................. 4-24 µR recorder............................................................................1-11 Numeric 1st weekday.......................................................................... 7-79 A B backlight saver.................................................................... 7-133 balancing.....
Index data length.................................................................7-111, 7-161 Data Monitor............................................................................ 1-4 data overview.......................................................................... 4-4 data storage method............................................................. 7-14 date format................................................................. 7-79, 7-141 day light saving.........................................
Index input type........................................................... 7-22, 7-46, 7-119 instrument information server..................................... 7-79, 7-142 inter-block delay....................................................... 7-112, 7-162 Internal Loop....................................................................... 7-202 internal switch.................................................. 7-86, 7-145, 7-186 interpolation................................................................
Index recorder’s communication parameters.................................... 2-2 Recorder List........................................................................... 7-1 recorder model determination...................................... 2-17, 2-24 Recorder Setting.......................................................... 2-15, 2-23 recording-related setting...................................................... 7-170 recording colors...................................................................
Index 1 TLOG computation............................................ 7-26, 7-56, 7-127 topic name............................................................................. 2-54 Transfer wait time.................................................................. 7-98 trend monitor.................................................................... 3-2, 8-8 trend type.............................................................................. 7-81 TRIG...................................................