User’s Manual WX13 AddTrigger IM WX13-01E 7th Edition
Thank you for purchasing AddTrigger. This user’s manual explains the operating procedures of the AddTrigger software. To ensure correct use, please read this manual thoroughly before beginning operation. After reading the manual, keep it in a convenient location for quick reference whenever a question arises. Notes • The contents of this manual are subject to change without prior notice as a result of continuing improvements to the software’s performance and functions.
Software License Agreement IMPORTANT - PLEASE READ CAREFULLY BEFORE INSTALLING OR USING: THANK YOU VERY MUCH FOR SELECTING SOFTWARE OF YOKOGAWA ELECTRIC CORPORATION ("YOKOGAWA"). BY INSTALLING OR OTHERWISE USING THE SOFTWARE PRODUCT, YOU AGREE TO BE BOUND BY THE TERMS AND CONDITIONS OF THIS AGREEMENT. IF YOU DO NOT AGREE, DO NOT INSTALL NOR USE THE SOFTWARE PRODUCT AND PROMPTLY RETURN IT TO THE PLACE OF PURCHASE FOR A REFUND, IF APPLICABLE. Software License Agreement 1.
Software License Agreement 5. Infringement 5.1 If you are warned or receive a claim by a third party that the Software Product in its original form infringes any third party's patent (which is issued at the time of delivery of the Software Product), trade mark, copyright or other intellectual property rights ("Claim"), you shall promptly notify Yokogawa thereof in writing. 5.
How to Use This Manual Structure of the Manual This user’s manual consists of the following chapters. Chapter 1 2 3 4 5 6 Title Before Using AddTrigger Description Gives an overview of the AddTrigger software. Lists the PC requirements for running AddTrigger, the installation procedures, and other information. Entering Settings (Launcher) Gives procedures for entering environment settings and conditions on AddTrigger. Logging Data (Launcher) Lists procedures for logging data.
1 Contents Software License Agreement............................................................................................................. ii How to Use This Manual................................................................................................................... iv Chapter 1 Before Using the AddTrigger Software 1.1 1.2 Chapter 2 Displaying Waveforms on Monitor Screens.......................................................................... 4-1 Setting the Display Conditions...
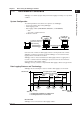
Chapter 1 Before Using the AddTrigger Software 1.1 1 Overview of Functions System Configuration 4 5 AddTrigger PC Scan and record measured data from a recorder or a similar instrument 2 3 The following hardware and software are required to use AddTrigger. • A personal computer (PC) running AddTrigger. • A data logging system. • Data logging software (DAQLOGGER, DAQ32Plus, or MXLOGGER). • A PC. • A recorder or similar instrument. • An Ethernet network.
1.1 Overview of Functions Scan Scan refers to the act of retrieving the measured data from the data logging software at a predetermined interval (scan interval). The scan interval of AddTrigger is the same as that specified on the data logging software to which AddTrigger is connected. Scan starts when AddTrigger is connected to the data logging software. Scan continues until the connection is dropped. The fastest scan intervals are indicated below. • When connected to DAQ32Plus: 0.
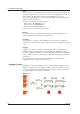
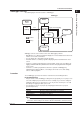
1.1 Overview of Functions 1 AddTrigger Structure Before Using the AddTrigger Software The following figure shows the structure of AddTrigger. AddTrigger 2 Monitor Monitor server 3 Display Scan Data memory Scan interval Data memory (1800 data) Logging Interval (logging) 4 Viewer Logger Redisplay Software Memory Logging status memory HD 5 HD 6 Display Launcher Index AddTrigger connects to the monitor server of the data logging software.
1.1 Overview of Functions Setting Up Logging Conditions You can enter the connection destination and logging conditions. The display conditions used when displaying the logged data using Historical Viewer can also be specified. See page 1-6, “Data Logging Conditions.” Starting and Stopping Scan/Record You can start or stop the scan. Also, you can set AddTrigger to start the scan when Launcher is started. You can also start or stop recording.
1.1 Overview of Functions Note The channels that can be displayed in the monitor are those for which Scan was set to ON in the channel settings under Log Settings (see page 2-18). • The displayed data is updated at the scan interval. • You can change the display conditions by carrying out tasks such as changing the channels assigned to a group and turning ON/OFF the waveform display. The display conditions can also be saved.
1.1 Overview of Functions Data Logging Conditions The data logging conditions are set using Launcher. Settings are available for logging, channels, groups, comments, and automatic conversion. Logging Settings You can specify the recording rate, trigger repeat count, logging start/stop conditions, data file output destination, data file name, and the trigger confirmation count. Logging Interval Set an integer multiple (recording rate) of the scan interval.
1.1 Overview of Functions 1 • Fixed Time (Start/Stop Conditions) A time within a 24-hour period (HH:MM:SS.SSS) can be specified. The times of the acquired data are scanned, and logging starts or stops when the time of the data retrieved from the monitor server is equal to or greater than the specified time. When logging, logging starts when the time of the data retrieved from the monitor server is equal to or greater than the specified time.
1.1 Overview of Functions Example: When the start condition is to scan for 1 alarm and the stop condition is to scan for 2 alarms (OR condition) Logging begins from the point the alarm occurs. At that point (B) the stop conditions are met (alarm 1 or 2 is occurring) but logging does not stop.
1.1 Overview of Functions 1 Example: w hen the start condition is to scan for 2 alarms and the stop condition is to scan for 1 alarms (OR condition). C’ Alarm 2 B C D Logging starts Stop Condition Alarm 1 Time A Pretrigger Function If the start condition is an alarm trigger or level trigger, you can use a pretrigger function. The pretrigger function allows you to save only the specified number of data prior to the trigger start point.
1.1 Overview of Functions Terminology for the Period of Data That Is Saved When Setting the Pretrigger Data held before the start trigger The area held in the internal memory that is prior to the point when the start trigger condition is met. Pretrigger width The period including the number of pretrigger data specified in the start conditions. Pretrigger width = scanning interval x recording rate x pretrigger count. Data saving period The period during which data is saved.
1.1 Overview of Functions When the Stop Condition is Data Count Data held before the start trigger > pretrigger width (most common case) • Pretrigger width < Specified width for data saving [2] 1 Before Using the AddTrigger Software When the stop condition is set to Data Count, data are saved from the number of data specified for the pretrigger that are prior to the start trigger point (start point of data saving). Then, the specified number of data are saved, and logging stops.
1.1 Overview of Functions • When the data saving period exists (not including the start trigger point) Pretrigger width < (specified width for data saving + data held before the start trigger) Data held before the start trigger Pretrigger width Start point of data saving Data saving period Time Start trigger point Specified width for data saving • When the data saving period does not exist Pretrigger width > (specified width for data saving + data held before the start trigger) Data is not saved.
1.1 Overview of Functions Trigger Confirmation Count Example in which the trigger confirmation count is set to 3 indicates the point when end condition is monitored. indicates the point when start condition is monitored. Logging period No logging indicates the point when the start condition is met. indicates the point when the end condition is met. Time Scan interval Logging start trigger condition Logging end trigger condition is met three consecutive times. is met three consecutive times.
1.1 Overview of Functions • Saving the Data to a Single File or Multiple Files The data in the logging period can be divided and saved in the following fashion. Data count: When a specified number of data points (logging count) is written to a file, AddTrigger starts writing data to a new data file. The number of data points of the last data file to which data is written may be less than the specified number of data points.
1.1 Overview of Functions 1 Channel Settings Group Settings From the channels defined in the connected data logging software, you can assign the channels from which data will be logged to groups. Up to 32 channels can be assigned per group. A single channel can be assigned to multiple groups.
1.1 Overview of Functions Miscellaneous Relationship between the Logging Start/Stop Conditions and Special Data The data that the data logging software scans and records contains the special data listed below. AddTrigger retrieves these types of data. • +OVER: data exceeding the high limit of the measurement range • –OVER: data below the low limit of the measurement range • LACK: data dropout • OFF: When data cannot be scanned and recorded because the communication with the recorder was cut off.
1.2 1 PC System 2 • Supported Operating Systems (OS) Run DAQWORX under any of the following operating systems.
1.2 PC System Requirements and Data Logging Software That Can Be Connected • Printer (Used When Printing) Printer and printer driver supported by the OS Note • • • If you continuously perform multiple data logging operations simultaneously using this software, fragmentation occurs in the free space on the disk to which data is saved. As fragmentation progresses, contiguous free space decreases and large data files are divided into pieces when they are saved.
Chapter 2 Entering Settings (Launcher) 2.1 1 Setup Flow A setup flow chart is shown below. 2 Section 3.1 Entering Settings (Launcher) Prepare the data logging software to which AddMulti is to be connected 3 Start AddTrigger Section 2.2 Set a project Section 2.3 • • • • • 4 5 Create a new project Copy a project Switch the project Change the password Delete a project 6 Index Set the data logging conditions • • • • Section 2.
2.2 Starting and Exiting AddTrigger Starting AddTrigger Procedure From the Windows Start menu, choose Programs > YOKOGAWA DAQWORX > AddTrigger > Launcher. The Launcher window appears. Note • • • The project that opens when AddTrigger is started is the project that was open the last time you exited the program. If the file list was displayed the last time you exited the program, the file list appears when you start the program this time.
2.3 1 Setting Up Projects A project is a group of settings required for operating AddTrigger. You can create as many projects as you like and save them. By switching projects, you can easily switch between different sets of AddTrigger settings. 2 Entering Settings (Launcher) 3 Note You cannot carry out the operations described below if scanning is in progress or when Programs other than the Launcher are running. 4 Creating a New Project Procedure 1.
2.3 Setting Up Projects 5. Enter a password in the New Password and Confirm boxes and click OK. Note • • • The password is used to open the project and cancel the password protection (see section 3.4). Enter a password using up to 16 alphanumeric characters. There are no restrictions on the characters that can be used. Do not forget the password (we recommend writing it down for future reference). Begin Scanning or Recording When Launcher Starts 6.
2.3 Setting Up Projects 1 Switching the Current Project Carry out the following procedure to switch to a different project. Procedure 1. Choose File > Project Settings from the Launcher menu bar. The Project Setting 2 Entering Settings (Launcher) dialog box opens. 2. Choose the desired project from the Project list box. 3 4 5 6 3. If the Use Password Protection check box is selected in the project that you selected, the Password Input dialog box opens. Index 4.
2.3 Setting Up Projects 2. Click Change. The New Password Setting dialog box opens. 3. Enter a password in the New Password and Confirm boxes and click OK. Note • • Enter a password using up to 16 alphanumeric characters. There are no restrictions on the characters that can be used. Do not forget the password. Deleting a Project Carry out the following procedure to delete a project. Procedure 1. Choose Project Settings from the File menu. The Project Setting dialog box opens. 2.
2.4 1 Entering Data Logging Conditions 2 Entering Settings (Launcher) This section describes how to enter the data logging conditions such as the connection destination, logging interval, and logging start/stop conditions. The display conditions used when displaying the logged data using Historical Viewer are also described. 3 Logging Settings You can enter the host name, port number, and system number of the PC running the monitor server.
2.4 Entering Data Logging Conditions Entering the Host Name 2. Click the Server Host text box, then enter the host name of the PC running the monitor server. Entering the Port Number 3. If the server is DAQ32Plus, DAQLOGGER, or MXLOGGER, click the Port No. text box and enter the port number. If the server is DAQ32Plus, DAQLOGGER, or MXLOGGER, click the Select Port Number button. Port number selection button A dialog box used to select the port number appears. Click the desired port number.
2.4 Entering Data Logging Conditions 1 Basic Operation Restrictions When Using the Configuration Dialog Box The following restrictions apply when using the Configuration dialog box. • If password protection is ON, all operations are disallowed. • If password protection is OFF and scanning is in progress, only the host name and port number can be changed. • If password protection is OFF and recording is in progress, all operations are disallowed.
2.4 Entering Data Logging Conditions Switching the Display ON/OFF, and Selecting/Clearing Items When you click a check box, the box’s color switches from blue to Gray. Blue: display ON, selected Gray: display OFF, cleared Clicking to Change Settings For the setting items in the figure below, clicking the cell causes the setting item to change.
2.4 Entering Data Logging Conditions 1 Entering Logging Settings Procedure Click the Record tab. 2 Entering Settings (Launcher) 3 4 5 Recording Rate The logging interval is specified in integral multiples of the scanning interval. An integer from 1-120 is specified for the recording rate setting. The logging interval is the product of the integer specified here and the scanning interval, and is shown in the right of the text box. 1. Click the Recording rate box and enter an integer value.
2.4 Entering Data Logging Conditions Start Condition 1. Click to display the list, then select Alarm, Level, or Daily fixed time. Alarm: The specified alarms on the specified channels are scanned, the trigger is activated if the conditions are met according to the statuses of those alarms, and logging begins.
2.4 Entering Data Logging Conditions 1 4. Click the channel to scan. The Channel No. dialog box opens. 2 Entering Settings (Launcher) 3 4 5 6 5. Click the channel for which you wish to set an alarm. In this dialog box, if the channel information of the currently downloaded monitor server information applies to the selected scanning channel, the channel is displayed in black.
2.4 Entering Data Logging Conditions 7. Click the Pretrigger box, and enter the number of data prior to the point at which the trigger conditions are met from which you wish to begin saving data. Save ime period for the specified data count (scan interval x recording rate x pretrigger data count) Allowed range for the pretrigger setting The setting range is from 0 to 1799 (see page 1-7, “Pretrigger Function”). The save time for the specified data is shown in the right of the box.
2.4 Entering Data Logging Conditions 1 4. Click a channel to scan. The Channel No. dialog box opens. 2 Entering Settings (Launcher) 3 4 5 6 5. Click the channel of the level you wish to scan. Here, if the channel settings from the currently downloaded monitor server information applies to the selected scanning channel, the channel is displayed in black.
2.4 Entering Data Logging Conditions 8. Click the Pretrigger box, and enter the number of data prior to the point at which the trigger conditions are met from which you wish to begin saving data. Save time period for the specified data count (scan interval x recording rate x pretrigger data count) Allowable rage for the pretrigger setting The setting range is from 0 to 1799 (see page 1-7, “Pretrigger Function”). The save time for the specified number of data is shown in the right of the box.
2.4 Entering Data Logging Conditions 1 Naming Convention (File Name Extension .mld) Date not added Add date (file division: per hour) Add date (file division: other than per hour) File name not specified 0000.mld YYYYMMDDHH-0000.mld YYYYMMDD-0000.mld File name specified file name-0000.mld file name-YYYYMMDDHH-0000.mld file name-YYYYMMDD-0000.mld 2 Entering Settings (Launcher) YYYY is the four-digit year, MM is the month, DD is the date, and HH is the hour. 0000 is the sequence number.
2.4 Entering Data Logging Conditions Channel Settings Select channels to which channels and data files acquired from the monitor server are saved. Also, the channel information (channel name, tag number, tag comment, max value, min value, units, and alarm settings) obtained using the procedure described in Retrieving and Displaying Host Information (see page 2-8) is displayed. Procedure Click the Channel tab.
2.4 Entering Data Logging Conditions 1 Group Settings These group settings are saved to data files, and when data files are displayed on data viewer (see chapter 5) these settings are also displayed. You can also apply the display conditions modified here to Data Monitor (see chapter 4). Procedure Show or Hide Group tab Floating point/exponential Zone (display position) Set the trip point.
2.4 Entering Data Logging Conditions Display Set the display format for numeric values. Select floating-point (100.0) or exponential (1.000E2). Floating-point and exponential toggle each time the box is clicked. Meter Type Click one of the option buttons to select the type of meter to be displayed on the meter monitor of Data Monitor from bar meter, analog meter, and thermometer. The setting is not used on Historical Viewer.
2.4 Entering Data Logging Conditions 1 Color Set the waveform display color. 1. Click the Color box. 2 The Color dialog box opens. Entering Settings (Launcher) 3 4 5 2. Click a color to select it. Click OK to confirm the new color. The dialog box closes. 6 Note To create a new color, click Define Custom Colors. Use the palette that appears to create the new color.
2.4 Entering Data Logging Conditions Copying the Group Settings from the Data Logging Software Carry out the following procedure to copy the group settings from the data logging software on the monitor server to AddTrigger groups. 1. Click Receive Group Settings. The Selection dialog box opens. 2. To also copy the group name, select the Get group names check box. Copying between the Same Group Numbers 3. Select the All groups check box. Click to clear all selections Click to select all items 4.
2.4 Entering Data Logging Conditions 1 Changing Settings 1. Click the group number for the settings you wish to change. 2. Select the channels you wish to change using the No. check boxes. Specifying Channels 2 3. Click a channel cell. The Channel No. dialog box opens. Entering Settings (Launcher) 3 4 5 6 Note Index Channels not active in the channel settings being downloaded from the monitor server are dimmed in the channel information dialog box. 4. Select the desired channels.
2.4 Entering Data Logging Conditions Comment Settings Comments related to data logging can be saved to a file. Comments are displayed as file information when opening a file on data viewer. They are also written to files when converting them to Text, Lotus, or Excel format. The name of the comment may contain up to 16 alphanumeric characters, and the comment itself may contain up to 64 characters. Up to 8 comments can be entered. Procedure 1. Click the Comment tab. 2.
2.4 Entering Data Logging Conditions 1 Selecting the Conversion and Division Types 1. Select any number of conversion types. If you do not wish to convert files, clear all check boxes. 2 2. Select a division type. If you select Channel, proceeded to Channel Division Settings. Entering Settings (Launcher) Channel Division Settings • Entering Settings One at a Time 3 1. Click the first or last channel number. The Channel No. dialog box opens. 4 5 6 Index 2.
2.4 Entering Data Logging Conditions 2. Set the start and end channels for the top line number (see steps 1 and 2 in, “Entering Settings One at a Time.”) 3. Click the shortcut button. All settings are filled down through the selection. Saving Modified Files • Specifying an Output Folder Specify the same folder (the output folder specified in the logging setting screen), or a separate folder in which to save data files.
2.5 1 Changing the Port Number Used by Data Monitor You can change the port number that Data Monitor uses. The new port number is activated the next time AddTrigger is started. The default port number is 50283. If other applications are not using this port number, you do not have to change it. 2 • • • Entering Settings (Launcher) 3 Note Set a value different from port numbers that other applications use. This port number is not the port number used by the monitor server of the data logging software.
2.6 Displaying the Version and Other Information Click the About Launcher button on the toolbar or choose Help > About. Version information The About dialog box opens. Version Company name User name License number Click OK to close the dialog box.
Chapter 3 3.1 Logging Data (Launcher) Preparing the Data Logging Software to Which AddTrigger Is to Be Connected Check the following items on the data logging software to which AddTrigger is to be connected. 1 2 • That the monitor server of the data logging software is running. • That the data logging software is scanning.
3.2 Scanning and Recording For the procedure for starting AddTrigger, see section 2.2. For the procedure for selecting the project, see section 2.3. Scan Record start Record stop Starting the Scanning Operation Procedure Click Scan start/stop on the Launcher’s toolbar or choose Scan from the Logger menu. AddTrigger retrieves all the data of the related channels that is scanned and held by the data logging software. Scanning starts.
3.2 Scanning and Recording 1 Starting the Recording Operation Procedure 1. Click Start on the Launcher’s toolbar or choose Start from the Logger menu. 2 Recording starts. Note If you carry out the operation to start recording when scanning is not in progress, scanning is started first and then recording is started. If Scan and record measurement data is selected in the project, scanning and recording start on the specified groups when the Launcher is started (see section 2.3).
3.3 Displaying the Data Logging Status, and Deleting the Data File List You can display the logging status on the launcher. The current data logging status is displayed in the upper part of the screen. The recording status is displayed using colors. If you exit while the data file list is displayed, the list is redisplayed the next time you start the program. You can drag to select the files you wish to display.
3.3 Displaying the Data Logging Status, and Deleting the Data File List Data file list: 2 3 You can select a file from the data file list to view the data file currently being logged or files that are finished being logged. Also, when browsing the data file list you can stop the data from updating so that the screen does not scroll and prevent you from viewing the data files that are finished being logged.
3.3 Displaying the Data Logging Status, and Deleting the Data File List Displaying the Logging Data Procedure Current data Pause updating Display selected data files Stop Updating of the List of Logged Files 1. Click Updating pause on the toolbar or choose View > Updating pause of the data file list from the menu bar. Even if the logging status of the data files currently being logged is Stop, those files do not appear in the list of logged files. Restart Updating of the List of Logged Files 2.
3.4 1 Using Password Protection You can use password protection to prevent accidental execution of operations. 2 Note Password protection can only be used on a project that is configured to use password protection. 3 Logging Data (Launcher) Enabling Password Protection Procedure 4 Choose Password Protection from the File menu. Password protection is enabled. Disabling Password Protection 5 Procedure Carry out the following procedure to disable password protection. 1.
3.5 Using Desktop Protection The desktop protection is a function used to hide the Windows Start menu and icon on the desktop. When the desktop protection is enabled, other programs cannot be started. This function prevents accidental execution of Windows functions that might interrupt AddTrigger operations. Enabling the Desktop Protection Procedure 1. Choose Desktop Protection from the File menu. The Hide Desktop dialog box opens. 2.
Chapter 4 4.1 Monitoring Data (Data Monitor) 1 Displaying Waveforms on Monitor Screens Data Monitor displays the data that is retrieved from the host at the scan interval. The following six types of monitor screens are available: Trend, Numeric, Meter, Alarm, Color Graph, and Circular. Data Monitor is started from the Launcher. 2 3 Note To change the port number that Data Monitor uses, see section 2.5. 4 Starting Data Monitor Monitoring Data (Data Monitor) Procedure 1.
4.1 Displaying Waveforms on Monitor Screens Note • • • The contents of the menu bar vary depending on the selected monitor screen. The toolbar displays all the tool buttons. However, only the buttons related to the selected monitor screen can be used.
4.1 Displaying Waveforms on Monitor Screens Pausing Data Monitor Click Pause on the toolbar or choose Pause from the File menu. The updating of the display of the monitor screen is paused. Click Pause again or choose Pause from the File menu to resume the updating of the monitor screen. 1 2 Pause 3 Note Data is retrieved even when the display updating is paused. When you resume the display updating, the data that was scanned while the monitor screen was paused is displayed.
4.1 Displaying Waveforms on Monitor Screens Alarm Monitor You can switch between Overview and Log by clicking the tab. Overview Display Displays the alarm conditions by groups. Switch between overview and log Display Cursor’s Value Displays the alarm status within the group. Alarm Status Display Green lamp: No alarm is activated in the channels registered in the group whose waveform display is turned ON. Or, no alarm is specified in any of the channels.
4.1 Displaying Waveforms on Monitor Screens Sounding Alarms and Stopping the Alarm Sound You can have AddTrigger generate an alarm sound whenever an alarm is activated. An alarm is sounded only when all the following conditions are met. • The alarm monitor is displayed. • The alarm sound function is turned ON. • Of the channels displayed in the monitor, at least one alarm is activated. Procedure Choose Alarm Sound from the File menu to place a check mark next to the command.
4.1 Displaying Waveforms on Monitor Screens Trend Monitor For the operating procedure, see section 4.3, “Changing the Waveform Display.” For operations using the cursor, see section 4.4, “Using Cursors.” Note Up to 1800 points of data can be displayed (30 minutes when the scan interval is set to 1 s). Select the displayed group Alarm ON/OFF Channel No., Tag No.
4.1 Displaying Waveforms on Monitor Screens 1 Changing the Time Axis You can change the time axis display. On the absolute time display, the date is displayed at the left end. Procedure 2 Choose Absolute Time or Relative Time from the Time-Axis menu. Absolute Time: Displays the time. Relative Time: Displays the elapsed time from the first data point. 3 Numeric Monitor Select the displayed group Alarm ON/OFF Channel No., tag No., Channel No., Tag No.
4.1 Displaying Waveforms on Monitor Screens Circular Monitor You can display one hour to four weeks worth of data on a circular graph. On the circular graph, the radius corresponds to the Y-axis of the trend display, and the circumference corresponds to the time axis. Select the displayed group Alarm ON/OFF The red bar blinks when an alarm occurs. Channel No., Tag No.
4.1 Displaying Waveforms on Monitor Screens Note • • Dragging the Trip Line You cannot drag the trip line on the circular monitor (page 4-17). To change the position of the trip line, change the value in the General Display Settings dialog box. Waveform Display Limit When the measured data is below the minimum display range, the waveform is displayed at the minimum value position; when the measured data is above the maximum value, the waveform is displayed at the maximum display position.
4.2 Setting the Display Conditions Set the display conditions for each group. Note You can select a channel identifier of Channel No., Tag No., or Tag Comment. In the explanations below, the channel identifier is set to Channel, but you can substitute Tag No. or Tag Comment according to your situation. Opening Setting Screens Procedure Click General Display Settings on the toolbar or choose General Display Settings from the View menu. The General Display Settings dialog box opens.
4.2 Setting the Display Conditions 2. Select the check boxes for the items to be copied and click OK. The dialog box 1 closes. 3. Click the tab corresponding to the copy source group. 2 4. Click Copy. 5. Click the tab corresponding to the copy destination group. 6. Click Paste. Showing/Hiding the Waveform, Y-Axis, Trip 1, and Trip 2 • Click the waveform number, Y-axis, trip 1, and trip 2 check boxes to switch between show (blue) and hide.
4.2 Setting the Display Conditions Setting the Display Conditions for Each Group Up to 32 channels can be assigned to a group. A maximum of 50 groups can be used. Procedure Show or Hide Group tab Linear display or Waveform display zone Set the trip point. logarithmic display Channel to be registered Turn ON/OFF the Color trip line display Meter type Display range Group name Axis type Y-axis display Thermometer Analog meter Bar meter Click a group tab to select the group.
4.2 Setting the Display Conditions 1 2. Click the desired channel. The channel is selected and the dialog box closes. To not assign a channel, click None at the bottom. 2 Showing/Hiding the Waveform Select the No. check box. Blue: Shows the waveform. Gray: Hides the waveform. 3 Y-Axis Display Set the display format for numeric values. Select floating-point (100.0) or exponential (1.000E2). Floating-point and exponential toggle each time the box is clicked.
4.2 Setting the Display Conditions Color Set the waveform display color. 1. Click the Color box. The Color dialog box opens. 2. Click a color to select it. The Color dialog box closes. Note To create a new color, click Define Custom Colors. Use the palette that appears to create the new color.
4.3 1 Changing the Waveform Display This section describes how to change the display on the trend monitor screen and the circular monitor screen. 2 Changing the Time Axis You can change the time axis display. On the absolute time display, the date is displayed at the left end. 3 Procedure Choose Absolute Time or Relative Time from the Time-Axis menu. Absolute Time: Displays the time. Relative Time: Displays the elapsed time from the first data point.
4.3 Changing the Waveform Display • User Zone Displays the waveform using the zone specified in the General Display Settings. • Edit Zone You can change the zone in the zone display area of the trend monitor screen. In the zone display area, drag the slider at the top and bottom ends of the zone bar to change the zone. The zone setting specified in the zone display area is reflected in the General Display Settings dialog box.
4.3 Changing the Waveform Display 1 • Multi-Axis Zone Displays the waveforms and multiple Y-axis (scale) in the zone specified in the General Display Settings. When Data Monitor display updating is paused, you can add/delete the Y-axis by carrying out the following procedure.* 2 When adding a Y-axis: In the zone display area, drag the zone bar to be displayed to the waveform display area. When deleting a Y-axis: In the waveform display area, drag the Y-axis to be deleted to the zone display area.
4.3 Changing the Waveform Display Assigning Display Limits You can specify how to display the waveform outside the display range. Procedure Click Clip on the toolbar or choose Clip from the Y-Axis menu. Clip The waveform display range along the Y-axis is limited to the minimum and maximum values of the scale specified in the General Display Settings.
4.3 Changing the Waveform Display 1 Moving the Trip Line You can move the trip line when display updating of Data Monitor is paused. Procedure 2 1. Click Pause on the toolbar or choose Pause from the File menu. The updating of the display on the monitor screen is paused. 2. Drag and drop the trip line to the desired position.
4.4 Using Cursors Cursors can be used on the trend monitor, color graph monitor, circular monitor, and alarm monitor. • On the trend monitor, color graph monitor, and circular monitor, the measured data at the cursor position can be read out. • On the alarm monitor, you can specify the alarm log using the cursor and read the measured data numerically at that point. • When Link is turned ON, the cursor movement is reflected on the trend monitor, color graph monitor, circular monitor, and alarm monitor.
4.4 Using Cursors The Cursor’s Value dialog box opens. The log date/time and values at the positions of cursor A and B are displayed. To finely adjust the cursor position, click the cursor adjustment buttons to the right of the data number. Click once to move the cursor by one data point. When you move the cursor on the monitor screen, the result is reflected in the Cursor’s Value dialog box. This behavior is also true the other way around.
4.4 Using Cursors 3. On the Log page of the alarm monitor, point to an alarm log and drag the mouse to the alarm log. The first position is cursor A; the second position is cursor B. The log time and values at the positions of cursor A and B are displayed in the Cursor’s Value dialog box. Display the values at the start and end points of the cursor selection area. Clearing Cursors Carry out the following procedure to clear the displayed cursors.
4.5 1 Saving the Connection Settings and Exiting the Monitor Saving the Connection Settings Connection settings refers to the display conditions of Data Monitor. If you save the connection settings before exiting Data Monitor, the condition is restored the next time Data Monitor is started. 2 3 Procedure Select Save from the File menu. The connection settings are saved to AddTrigger installation folder\project name\folder.rmt).
Chapter 5 5.1 Displaying Logged Data (Historical Viewer) 1 Displaying Waveforms on Historical Viewer Historical viewer displays the data that has been logged using waveforms or values. You can start Historical Viewer from the Launcher or the Windows Start menu. 2 Starting Historical Viewer 3 Procedure Start Historical Viewer using one of the following methods. • Click Historical Viewer on the Launcher’s toolbar or choose Historical Viewer from the View menu.
5.1 Displaying Waveforms on Historical Viewer Opening Data Files Procedure 1. Click Open on the toolbar or choose Open from the File menu. Open The Open dialog box appears. 2. Select the desired file (the information about the selected file is displayed at the bottom section of the dialog box) and click Open. Waveforms are displayed. Note • • • Historical viewer can only display data that has been logged using AddTrigger. The extension is .mld. You can open multiple data files simultaneously.
5.1 Displaying Waveforms on Historical Viewer 1 3. Carry out the following procedure to switch between waveform display and numeric display. • Click Waveform Display on the toolbar or choose Window > Waveform Display from the menu bar. • Click Digital Value Display on the toolbar or choose Window > Digital Value Display from the menu bar.
5.1 Displaying Waveforms on Historical Viewer Data Overview When set to waveform display, dragging the Overview spreader downward shows the Data Overview. The Data Overview displays the measured data by assigning the following 50 colors in order. Blue (minimum display scale), light blue, green, yellow, red (maximum display scale). The waveforms in the section enclosed in the white frame on the Data Overview are displayed. The parts enclosed in the white frame are displayed as waveforms.
5.1 Displaying Waveforms on Historical Viewer 1 Viewing Information about the Loaded File You can view the information about the data file in the active window. Procedure 2 1. Choose About Document from the Information menu to display the File Information dialog box. 3 4 5 figure). Click Print Title and enter the character string (up to 32 alphanumeric characters). You can also enter or change the print title in the Printout Setup dialog box.
5.2 Setting the Display Conditions You can specify the display conditions for each group. Note You can select a channel identifier of Channel No., Tag No., or Tag Comment. In the explanations below, the channel identifier is set to Channel, but you can substitute Tag No. or Tag Comment according to your situation. Basic Operation Procedure Waveform number Show or Hide A B A C A C A to D are the collective setup buttons (see the next page).
5.2 Setting the Display Conditions Showing/Hiding the Waveform, Y-Axis, Trip 1, and Trip 2 • Click the waveform number, y-axis, trip 1, and trip 2 check boxes to switch between show (blue) and hide. • If consecutive cells are selected, you can click the tool cell at the bottom to collectively switch the show/hide setting of all the cells in the selected range. 1 2 Using the Shortcut Buttons There are four kinds of shortcut buttons. You can enter a setting on every cell in the range all at once.
5.2 Setting the Display Conditions Click a group tab to select the group. Group Name Click the Group Name box and enter the group name using up to 16 alphanumeric characters. Tag Number 1. Click a tag number box. The Tag Number dialog box opens. 2. Click the desired channel. The channel is selected and the dialog box closes. To assign no channel, click None at the bottom. Showing/Hiding the Waveform Select the No. check box to change the setting. Blue: Shows the waveform.
5.2 Setting the Display Conditions Zone Click the value box and enter the maximum and minimum values of the waveform display zone. The range of values that can be entered is 0 to 99% for the minimum value and 1 to 100% for the maximum value. 1 2 Trip 1 and Trip 2 Click the value box and enter the position of the trip line within the scale range. When you enter a value, the check box turns blue. If you do not wish to use the trip line, clear the check box. Blue: Enable. Gray: Disabled.
5.3 Changing the Waveform Display and Numerical Display This section describes how to change the display on Historical Viewer screen. Changing the Time Axis You can change the time axis display. On the absolute time display, the date is displayed at the left end. Procedure Choose Absolute Time or Relative Time from the Time-Axis menu. Absolute Time: Displays the time. Relative Time: Displays the elapsed time from the first data point.
5.3 Changing the Waveform Display and Numerical Display 1 Selecting the Waveform Display Zone You can change the display zone of the waveform. Procedure Click an icon for the waveform display zone on the toolbar or choose Waveform display zone from the Y-Axis menu. Full Zone Edit Zone User Zone Slide Zone Auto Zone Multi-Axis Zone 3 4 • User Zone Displays the waveform using the zone specified in the General Display Settings.
5.3 Changing the Waveform Display and Numerical Display • Slide Zone The zone width of each waveform is made equal, and the start position of the display zone is offset slightly for each waveform. • Auto Zone Displays the waveforms by equally dividing the waveform display area according to the number of displayed waveforms. • Multi-Axis Zone Displays the waveforms and multiple Y-axis (scale) in the zone specified in the General Display Settings.
5.3 Changing the Waveform Display and Numerical Display 1 Assigning Display Limits You can specify how to display the waveform outside the display range. Procedure 2 Click Clip on the toolbar or choose Clip from the Y-Axis menu. Clip The waveform display range along the Y-axis is limited to the minimum and maximum values of the scale specified in the General Display Settings.
5.3 Changing the Waveform Display and Numerical Display Adjusting the Brightness You can adjust the brightness of the grid and background. Procedure Drag the grid brightness adjustment slider to change the grid brightness. Drag the brightness adjustment slider of the waveform display area to change the area’s brightness. Moving the Trip Line Procedure Drag and drop the trip line to the desired position.
5.
5.4 Using Cursors On the Graph screen, the measured data at the cursor position can be read. There are two cursors, cursor A and cursor B. The Cursor’s Value dialog box displays the measured data numerically at the positions of cursor A and cursor B and the difference between the two. You can specify an area using cursor A and cursor B and display the maximum value, minimum value, P-P value, average value, and rms value of the measured data in the area.
5.4 Using Cursors 1 Clearing Cursors Carry out the following procedure to clear the displayed cursors. Procedure 2 Choose Hide Cursor from the View menu. When you clear the cursors, nothing is displayed in the Cursor’s Value dialog box. Copying the Data between the Cursors to the Clipboard You can copy the data in the range specified Using Cursors to the clipboard for use in other applications. Procedure 1.
5.4 Using Cursors Displaying Statistical Computation Results over an Area You can specify an area using cursor A and cursor B and display the maximum value, minimum value, P-P value, average value, and rms value of the measured data in the area. Procedure 1. Specify the computation area by dragging the mouse on the Graph screen or Sheet screen. 2. Click Area Calculation on the toolbar or choose Display Calculation Results from the Window menu.
5.5 1 Using Marks Marks can be placed at the positions specified with the cursor. By default, the following marks are placed. • TRIG: Data at the logging start point (first data of the file) • BOUNDARY: Data at the division point when the logged data is stored to divided files (first data point of files after the 1st file) and the first data point of the file that is created by data exporting (see section 5.9). Placing Marks 2 3 4 Procedure 1.
5.5 Using Marks Deleting Marks Procedure 1. Place cursor A and cursor B so that the marks to be deleted are in between the cursors. 2. Choose Delete Mark from the Edit menu. The marks between cursor A and cursor B are deleted. Setting the Marks to the Default Condition (Clearing All Marks Except TRIG and BOUNDARY) Procedure Choose Reset Mark from the Edit menu. All the added marks are deleted.
5.6 1 Searching for Measured Data, Alarms, and Marks You can set search conditions and search for measured data, alarms, and marks. When the measured data, alarm, or mark is found, the cursor is displayed at that position. 2 Procedure 1. Select the search range Using Cursors. 2. Click Search on the toolbar or choose Edit > Search from the menu bar. 3 Search settings 4 The Search dialog box opens.
5.6 Searching for Measured Data, Alarms, and Marks 6. Select the channels to be searched. Click the channel selection button. The Tag Number dialog box displays the channels that are contained in the group. Click a channel. Click ALL to select all the channels in the group to be searched. The selected channels are displayed on the channel selection button. 7. Click the list box and select the type of data to be searched. LACK: Search for data dropouts.
5.6 Searching for Measured Data, Alarms, and Marks ON: Data position where the alarm is ON. OFF: Data position where the alarm is OFF. 1 2 When Searching for Measured Data 5. Select the groups to be searched. The operating procedure is the same as that in “When Searching for Special Data.” 6. Select the channels to be searched. The operating procedure is the same as that in “When Searching for Special Data.” 7. Set the type of comparison. The reference value is set in step 8.
5.6 Searching for Measured Data, Alarms, and Marks Example of an Alarm Search This section explains the procedure for searching for the point of change of alarm level 1 of channel TAG0005 in the range specified by the cursors. 1. Display the waveform and specify a range Using Cursors. 2. Click Search on the toolbar. The Search dialog box opens. 3. Set the search conditions as follows. OR/AND: You do not have to change this, because only one condition will be specified.
5.7 1 Linking and Displaying Data Files File Link and Display Function Data files that are continuous in time can be linked and displayed. Historical viewer can handle data files that have been saved to divided files as a single file.
5.7 Linking and Displaying Data Files 3. When the name of the file you wish to link is selected, the Select Option dialog box may appear. Select either process, and click Select to perform the link. Note • • The Select Option dialog box appears when adding the selected file causes the number of displayed data points to be 8 KB or more and the load size to be 10 MB or more. For details, see “Opening Data Files” in section 5.1.
5.7 Linking and Displaying Data Files 1 Displaying a List of Linked Files You can display a list of linked files and check the link condition of the current file. Procedure 2 Select Link Files from the Window menu. The Link Files dialog box appears. 3 The displayed information consists of File, Start, and End. The list is displayed in order from the oldest start time.
5.8 Converting the Data Format You can convert data files to ASCII, Lotus, or Excel data format. The names of the converted files are as follows: • Converted to ASCII: original file name.txt • Converted to Excel: original file name.xls The file can be opened on Excel version 8.0 (Excel97) or later. • Converted to Lotus: original file name.wj2 The file can be opened on Lotus1-2-3 version 2.0 or later. Procedure 1. Choose To ASCII, To Lotus, or To Excel from the Convert menu.
5.8 Converting the Data Format 1 5. Select the destination and the file type and enter the file name. 6. Click OK. The measured data is converted to the selected data format and saved to the file. 2 File Conversion Format of Logged Data The Lotus 1-2-3, Excel, and ASCII file formats are indicated below.
5.8 Converting the Data Format • Title 1 2 3 4 5 6 7 8 9 10 11 12 13 “ A d d T r i g g e r ( R 21 22 23 24 25 26 27 28 29 30 31 32 33 S o f t w a r e I D 41 42 43 44 45 x x ” CR LF 14 15 16 17 18 19 20 X . X X ) 34 35 36 37 38 39 40 x x x - x x x RX.XX is the software revision number. SoftwareID is the license number.
5.
5.8 Converting the Data Format • Tag comment 1 2 3 4 " T a g ? . . . . 6 7 8 9 10 11 12 13 14 C o m m e n t " , . . . ? " , Tag comment 2 " 5 . . . . . 15 . . . . " Tag comment 1 " . . . . ? , ? ? CR LF The length occupied by a tag comment varies depending on the length of the character string. Each tag comment is enclosed in quotations. Thus, the length occupied by a single tag comment is "the length of the tag comment + 2.
5.8 Converting the Data Format 1 • Time Data Was Measured and the Measured Data For absolute time 1 2 3 4 5 6 7 8 9 10 11 " Y Y Y Y - M M - D D 21 22 23 24 25 26 27 28 29 30 31 . S S S " , 41 42 43 44 45 46 12 32 13 14 15 16 17 18 19 20 H H : m m : S S 33 34 35 36 37 38 39 40 Measured value 1 , 2 Measured value 2 ? ? , . . . . . . . . . . . .
5.9 Exporting Data You can extract (copy) a section of a data file and save the result. This operation does not change the original data. Procedure 1. Select the range of data to be extracted by using cursors. 2. Choose Export from the Convert menu. The Export dialog box opens. 3. The range that was selected by the cursors is indicated in the Start and End boxes using data numbers. The logging time is displayed to the right of the text box.
1 5.10 Printing the Data You can print out the measured data that is displayed on Historical Viewer. 2 Selecting the Printer You can specify the printer used to print the data. The printer setup operation is the same as that of the standard Windows print command. Procedure 3 1. Choose Print Setup from the File menu. 4 The Print Setup dialog box opens. 2. Change the items in the dialog box as needed, and then click OK.
5.10 Printing the Data Printing the Data Procedure 1. Click Print on the toolbar or choose Print from the File menu. Print 2. Specify the print range and other information. For graphs, click the option button to set the range and color. Enter a print title if desired. For sheets, specify the print range. 3. Click OK. The Print dialog box opens. 4. Select the printer name and number of copies, and click OK. Printing starts. Note The print range on the Print dialog box is void.
1 5.11 Saving the Display Settings, Saving the Link Settings, and Exiting Historical Viewer When exiting Historical Viewer, the display settings can be saved. The next time Historical Viewer is started the display settings are restored. You can also save the display settings by choosing Save Display Setting from the File menu. When multiple data files are linked and displayed using the file link display function described in section 5.
5.11 Saving the Display Settings, Saving the Link Settings, and Exiting Historical Viewer Exiting Historical Viewer If there are any unsaved display settings, a message appears prompting you to choose whether or not to save the settings. Make a selection as to whether or not to save the settings. Procedure 1. Choose Exit from the File menu or click the X button at the right end of the title bar.
Chapter 6 6.1 Error Messages and Corrective Actions 1 Error Messages and Corrective Actions A message may appear on the screen during operation. This section describes the meanings of the messages and their corrective actions. Code E0002 E0003 E0004 E0101 E0211 Cannot write to the file. E4213 E4601 Failed to create folder. Different server type. Check the connected host name and port number. E4602 The number of allowable client connections was exceeded.
6.1 Error Messages and Corrective Actions Code E4626 E4633 E4634 E4635 E4637 E4638 E4640 Message Cannot shut down Windows while AddTrigger is running. A project with the same name already exists. Failed to start the logger. Failed to start the monitor server. Failed to start the file processor. Failed to start Data Monitor. Failed to start the data viewer. Invalid project name. E4643 E4653 Could not create data file output folder. No effective logging channels.
Index 1 Index 2 Symbols E +OVER....................................................................... 1-16, 5-22 –OVER....................................................................... 1-16, 5-22 edit zone..................................................................... 4-16, 5-11 enabling password protection................................................ 3-7 enabling the desktop protection............................................ 3-8 end condition.......................................
Index P T password............................................................................... 3-8 password protection................................................ 1-3, 2-3, 2-4 per Day................................................................................ 1-14 per Hour.............................................................................. 1-14 placing marks...................................................................... 5-19 port number........................................