
Manual

5-21
M-4660
Screen Operations
1
2
3
4
5
6
7
8
9
10
11
12
13
App
Index
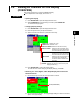
5.6 Displaying Stacked Bar Graphs (COLUMN BAR)
Note
• The numbers on the vertical axis of display area 4 (the top display area) and the dates on
the horizontal axis are abbreviated.
• Display area 4 can only display the data from the period immediately preceding that of
display area 3.
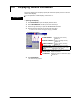
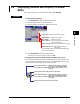
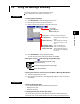
• SelectingaBar
When in SINGLE GRAPH display, you can move the cursor to a bar that you want to
check, and view the sums of each channel.
Displays the sums of all channels
at the cursor position.
Cursor
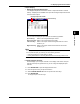
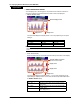
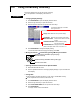
• Power Failure and Time Adjustment Indication
Indicates a power failure.
Time adjustment is indicated by a C.
• Power Failure
A “P” indicates when a power failure occurred and a report was supposed to be
led. A “P” also indicates when the MV recovered from a power failure and the next
report was led.
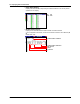
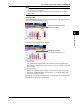
• Time Adjustment
When a time adjustment causes a report to be led twice because the time was
moved back, the time adjustment is marked with a “C,” and the bar graph of the
report that was led rst is used.
If the data for a period does not exist because of a power failure or time adjustment, a
bar graph for the period will not be displayed.