
Manual

5-20
M-4660
Explanation
• SINGLE GRAPH/DUAL GRAPH
You can display one or two bar graphs. The periodic sums of the rst channel in a
group and of all other channels that have the same unit as it are displayed.
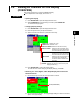
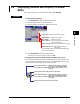
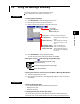
• SINGLE GRAPH display
Numeric display section
Display area 1
Display area 2
The report data displayed in display areas 1 and 2 vary depending on the report
data type.
Report Data Type Display Area 1 Display Area 2
Hour + Day Hourly data Daily data
Day + Week Daily data Weekly data
Day + Month Daily data Monthly data
Note
When in 4-panel display, the numeric display section only contains channel names or tag
names.
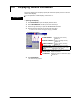
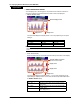
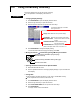
• DUAL GRAPH display
Shows the data from two consecutive periods at the top and bottom of the display.
Channel number or tag name
Numbers are abbreviated.
Display area 1
Display area 3
Display area 4
Display area 2
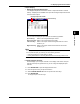
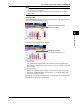
The report data displayed in display areas 1, 2, 3, and 4 vary depending on the
report data type. Display areas 1 and 2 contain the same report data listed above
for SINGLE GRAPH display.
Report Data Type Display Area 4
Hour + Day The hourly and daily data of the day before the data in
display area 3
Day + Week The daily and weekly data of the week before the data
in display area 3
Day + Month The daily and monthly data of the month before the
data in display area 3
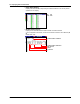
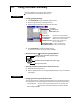
5.6 Displaying Stacked Bar Graphs (COLUMN BAR)