
Manual

5-19
M-4660
Screen Operations
1
2
3
4
5
6
7
8
9
10
11
12
13
App
Index
5.6 Displaying Stacked Bar Graphs (COLUMN
BAR)
This section explains how to use the bar graph display (COLUMN BAR).
Procedure
• ChangingDisplaySettings
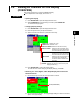
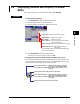
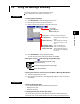
1.
Press DISP/ENTER to open the display selection menu.
2.
Press the right arrow key to open the submenu.
3.
Select a submenu item with the up and down arrow keys.
REPORT GROUP 1 to 6*: Switch between displayed
report groups.
* Varies according to model. For more information about report
channels, see section 10.5.
SELECT GROUP: Use the arrow keys to switch between
displayed report groups.
SELECT COLUMN: Use the arrow keys to select a bar graph.
SINGLE GRAPH: Displays a single graph.
DUAL GRAPH: Displays two graphs.
Display name: Switches to the specified display.
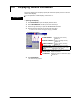
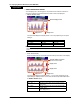
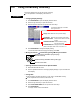
4.
Press DISP/ENTER to change the display setting.
To close the menu without changing the display, press
ESC
.
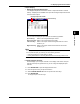
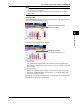
• ChangingGroups,SelectingBarGraphs,andMovingtheCursor
The amount of data that the up and down arrow keys scroll through depends on the
type of report data. For example, with an hourly + daily (Hour+Day) report, you can
use the arrows to scroll through the data one day at a time.
If set to SELECT GROUP: Switches to the display for the report
group with the next smallest number.
If set to SELECT COLUMN: Moves the bar graph selection cursor
to the left.
Switches to the previous day, week or month's data.
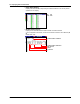
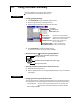
If set to SELECT GROUP: Switches to the display for the report
group with the next highest number.
If set to SELECT COLUMN: Moves the bar graph selection cursor
to the right.
Switches to the next day, week or month's data.