
Instruction Manual

4-19
IM 04L47B01-01EN
1
2
3
4
5
IndexIndex
Data Display Methods
Waveform display restrictions
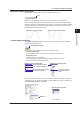
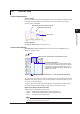
Select Y-Axis > Clip from the menu bar or click the following icon.
Clip
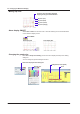
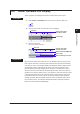
Restriction of the waveform display range in Y-axis direction is possible from the
minimum value to the maximum value set with “Scale” in the “General Display Settings”
dialog box. Measuring values smaller than the minimum scale value are displayed pasted
to the minimum value, and measuring values larger than the maximum scale value are
displayed pasted to the maximum value.
• Examples for restricted display • Examples for unrestricted display
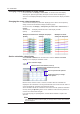
Legend display switching
Select View > Legend from the menu bar or click the following icon to switch between
showing and hiding the legend.
Legend display switching
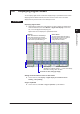
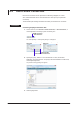
Legend has a channel display mode and an axis display mode.
• Channel display mode
Channel display is made. Show or Hide can be selected for each axis.
• Axis display mode
Y-axis and channel are displayed.
In case of grouping, hierarchical display is made for each unit or group.
Show or Hide can be selected for all axes.
Example for channel display mode Example for axis display mode
Display mode switching button
Click for waveform Show/Hide
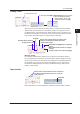
State with hidden waveform display
State with waveform display
All waveform display of
lower hierarchical levels
hidden
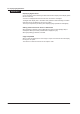
Either the channel name, tag name, or tag number is used as an identifier for channels
in the legend. You can switch the identifier by clicking Vi
ew on the menu bar followed by
Channel number, Tag name, or Tag No.
Select one
When Tag name is selected
4.5 Changing the Waveform Display